16. 10. 2007 Comparison of dashboard monitoring output and CSCS local monitoring and logs
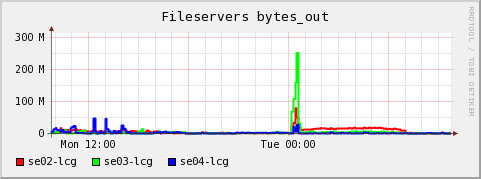
Note: Julia Andreeva explained that the discrepancy derives from the times in the dashboard referring to submission times and not run times. So, a comparison like the one below is not easy to do at the moment. But it is clear that the job I/O rates given by the dashboard do not reflect the true I/O rates. Not clear yet whether this mainly is true for very short jobs. The ganglia graphs show that between 0h and 1h this night there was a high level of read access to our SE. Since there was some discussion on these rates and the CMS Dashboard showed different numbers for some test cases, I try to follow this up more thoroughly: All graphs cover the time from 2007-10-15 noon to 2007-10-16 noon. The interesting section is from midnight to about 1 o'clock.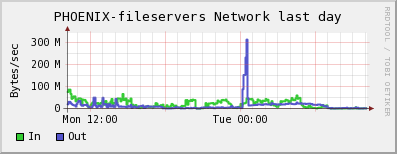 Fileserver I/O
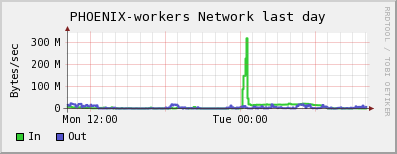 Worker Node I/O
total worker nodes "network-input" goes up to 300 MB/s
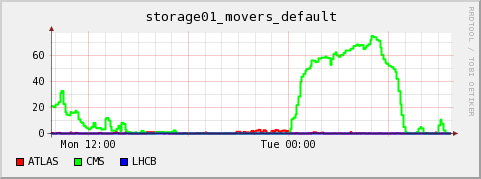
The following graph lists the number of dCache movers for LAN access per VO. The load was generated by CMS accesses. The
graph is convoluted by other CMS jobs which set in after 1 o'clock, mainly cmsprod ones, which also use direct dcap access to the dCache. But the initial rise matches well the one in the "running jobs" further below.
Worker Node I/O
total worker nodes "network-input" goes up to 300 MB/s
The following graph lists the number of dCache movers for LAN access per VO. The load was generated by CMS accesses. The
graph is convoluted by other CMS jobs which set in after 1 o'clock, mainly cmsprod ones, which also use direct dcap access to the dCache. But the initial rise matches well the one in the "running jobs" further below.
 I can see 45 jobs from Stefano between 2007-10-16 00:38 and 00:48h in the PBS accounting logs. Only five other CMS
jobs ran in this interval (look at bottom of this page for details).
This is consistent with the Ganglia graph about the running jobs (but it's not easy to extract details from that graph):
I can see 45 jobs from Stefano between 2007-10-16 00:38 and 00:48h in the PBS accounting logs. Only five other CMS
jobs ran in this interval (look at bottom of this page for details).
This is consistent with the Ganglia graph about the running jobs (but it's not easy to extract details from that graph):
 running jobs
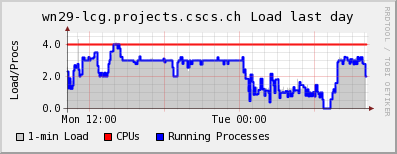
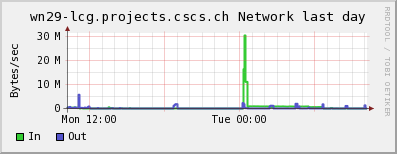
Example for a single node: wn29-lcg.projects.cscs.ch with a load of 2-3, shows about 30 MB/s read
running jobs
Example for a single node: wn29-lcg.projects.cscs.ch with a load of 2-3, shows about 30 MB/s read
 The PBS logs show indeed that three of Stefanos's jobs were running in parallel around that time:
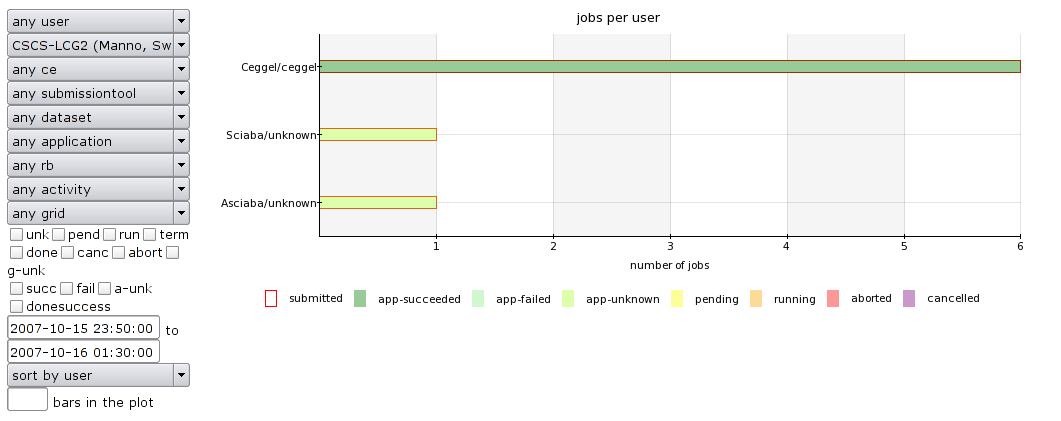
10/16/2007 00:24:57 cms012 wn29-lcg Exit_status=0 cput=00:04:53 mem=344728kb vmem=559388kb walltime=00:06:59
10/16/2007 00:31:02 cms012 wn29-lcg Exit_status=0 cput=00:04:50 mem=326240kb vmem=539596kb walltime=00:07:33
10/16/2007 00:32:32 cms012 wn29-lcg Exit_status=0 cput=00:04:40 mem=358196kb vmem=572424kb walltime=00:07:34
In the Dashboard I just find 6 analysis jobs from 0h to 1:30. Even if I prolong the time, there are no more. The jobs coming in later are production jobs The dashboards lists these six jobs as belonging to Christina Eggel, but the cluster logs show that she was not running at that time. Dashboard link
Detailed log excerpts from our PBS: Mappings:
- cms008 ceggel
- cms012 belforte
10/16/2007 00:18:36 cms012 wn33-lcg Exit_status=0 cput=00:04:43 mem=313096kb vmem=515560kb walltime=00:07:02
10/16/2007 00:19:04 cms012 wn24-lcg Exit_status=0 cput=00:04:43 mem=337692kb vmem=552152kb walltime=00:06:56
10/16/2007 00:19:04 cms012 wn26-lcg Exit_status=0 cput=00:04:17 mem=330264kb vmem=543708kb walltime=00:06:00
10/16/2007 00:19:33 cms012 wn23-lcg Exit_status=0 cput=00:05:18 mem=321496kb vmem=526176kb walltime=00:07:30
10/16/2007 00:21:21 cms012 wn34-lcg Exit_status=0 cput=00:04:22 mem=354508kb vmem=569924kb walltime=00:06:29
10/16/2007 00:21:49 cms012 wn14-lcg Exit_status=0 cput=00:06:33 mem=305408kb vmem=520760kb walltime=00:09:42
10/16/2007 00:21:58 cms012 wn24-lcg Exit_status=0 cput=00:04:55 mem=340100kb vmem=554260kb walltime=00:07:00
10/16/2007 00:22:16 cms012 wn30-lcg Exit_status=0 cput=00:04:17 mem=326636kb vmem=539820kb walltime=00:06:38
10/16/2007 00:24:57 cms012 wn29-lcg Exit_status=0 cput=00:04:53 mem=344728kb vmem=559388kb walltime=00:06:59
10/16/2007 00:25:16 cms012 wn17-lcg Exit_status=0 cput=00:04:34 mem=377512kb vmem=590132kb walltime=00:06:57
10/16/2007 00:26:06 cms012 wn26-lcg Exit_status=0 cput=00:04:59 mem=381692kb vmem=589832kb walltime=00:07:00
10/16/2007 00:26:11 cms012 wn23-lcg Exit_status=0 cput=00:04:48 mem=345924kb vmem=558472kb walltime=00:06:36
10/16/2007 00:26:35 cms012 wn24-lcg Exit_status=0 cput=00:04:49 mem=342872kb vmem=566672kb walltime=00:07:29
10/16/2007 00:26:51 cms012 wn35-lcg Exit_status=0 cput=00:04:41 mem=325796kb vmem=539760kb walltime=00:06:30
10/16/2007 00:27:51 cms012 wn34-lcg Exit_status=0 cput=00:04:37 mem=360372kb vmem=588180kb walltime=00:06:27
10/16/2007 00:28:18 cms012 wn26-lcg Exit_status=0 cput=00:04:44 mem=372688kb vmem=595912kb walltime=00:07:29
10/16/2007 00:28:34 cms012 wn24-lcg Exit_status=0 cput=00:04:25 mem=332364kb vmem=561816kb walltime=00:06:33
10/16/2007 00:29:20 cms012 wn30-lcg Exit_status=0 cput=00:04:39 mem=409668kb vmem=643228kb walltime=00:07:02
10/16/2007 00:29:43 cms012 wn37-lcg Exit_status=0 cput=00:04:54 mem=338020kb vmem=548032kb walltime=00:07:58
10/16/2007 00:30:58 cms012 wn08-lcg Exit_status=0 cput=00:03:59 mem=288692kb vmem=500112kb walltime=00:05:34
10/16/2007 00:31:02 cms012 wn29-lcg Exit_status=0 cput=00:04:50 mem=326240kb vmem=539596kb walltime=00:07:33
10/16/2007 00:31:29 cms012 wn39-lcg Exit_status=0 cput=00:04:36 mem=321776kb vmem=528484kb walltime=00:06:30
10/16/2007 00:31:35 cms012 wn36-lcg Exit_status=0 cput=00:04:32 mem=335248kb vmem=538840kb walltime=00:07:30
10/16/2007 00:32:18 cms012 wn17-lcg Exit_status=0 cput=00:04:40 mem=392936kb vmem=624740kb walltime=00:07:01
10/16/2007 00:32:32 cms012 wn29-lcg Exit_status=0 cput=00:04:40 mem=358196kb vmem=572424kb walltime=00:07:34
10/16/2007 00:34:11 cms012 wn26-lcg Exit_status=0 cput=00:05:12 mem=346536kb vmem=552036kb walltime=00:08:03
10/16/2007 00:34:13 cms012 wn24-lcg Exit_status=0 cput=00:04:48 mem=331984kb vmem=543256kb walltime=00:07:32
10/16/2007 00:34:15 cms012 wn17-lcg Exit_status=0 cput=00:04:53 mem=386824kb vmem=608548kb walltime=00:08:33
10/16/2007 00:34:16 cms012 wn23-lcg Exit_status=0 cput=00:04:51 mem=344800kb vmem=557516kb walltime=00:08:03
10/16/2007 00:34:24 cms012 wn35-lcg Exit_status=0 cput=00:04:47 mem=388464kb vmem=611836kb walltime=00:07:29
10/16/2007 00:34:24 cms012 wn37-lcg Exit_status=0 cput=00:05:14 mem=344976kb vmem=552660kb walltime=00:07:31
10/16/2007 00:34:37 cms012 wn25-lcg Exit_status=0 cput=00:04:59 mem=364492kb vmem=574996kb walltime=00:08:33
10/16/2007 00:35:37 cms012 wn24-lcg Exit_status=0 cput=00:04:34 mem=356456kb vmem=565896kb walltime=00:07:01
10/16/2007 00:35:38 cms012 wn20-lcg Exit_status=0 cput=00:04:25 mem=333200kb vmem=542564kb walltime=00:08:03
10/16/2007 00:35:47 cms012 wn21-lcg Exit_status=0 cput=00:04:43 mem=403924kb vmem=661196kb walltime=00:07:30
10/16/2007 00:35:55 cms012 wn17-lcg Exit_status=0 cput=00:05:06 mem=334204kb vmem=545228kb walltime=00:09:03
10/16/2007 00:36:19 cms012 wn34-lcg Exit_status=0 cput=00:04:57 mem=328180kb vmem=544592kb walltime=00:08:26
10/16/2007 00:36:22 cms012 wn30-lcg Exit_status=0 cput=00:04:53 mem=319240kb vmem=535068kb walltime=00:06:59
10/16/2007 00:36:48 cms012 wn26-lcg Exit_status=0 cput=00:05:03 mem=329196kb vmem=532016kb walltime=00:08:28
10/16/2007 00:36:52 cms012 wn33-lcg Exit_status=0 cput=00:05:06 mem=326684kb vmem=538564kb walltime=00:07:59
10/16/2007 00:37:22 cms012 wn37-lcg Exit_status=0 cput=00:04:41 mem=339256kb vmem=552724kb walltime=00:07:33
10/16/2007 00:37:32 cms012 wn28-lcg Exit_status=0 cput=00:04:29 mem=344888kb vmem=566512kb walltime=00:07:04
10/16/2007 00:37:38 cms012 wn21-lcg Exit_status=0 cput=00:04:46 mem=328276kb vmem=540560kb walltime=00:07:59
10/16/2007 00:37:59 cms012 wn38-lcg Exit_status=0 cput=00:04:34 mem=330128kb vmem=543836kb walltime=00:07:32
10/16/2007 00:38:02 cms012 wn23-lcg Exit_status=0 cput=00:04:40 mem=341288kb vmem=549720kb walltime=00:07:03
The only other CMS jobs in between 0h and 1h:
10/16/2007 00:12:07 cmsprd Exit_status=0 cput=00:00:15 mem=25816kb vmem=76628kb walltime=00:01:13
10/16/2007 00:12:38 cmssgm Exit_status=0 cput=00:00:36 mem=100100kb vmem=269368kb walltime=00:01:02
10/16/2007 00:22:39 cmsprd Exit_status=0 cput=00:00:55 mem=103820kb vmem=401104kb walltime=00:16:06
10/16/2007 00:44:43 cms008 Exit_status=0 cput=00:06:40 mem=800136kb vmem=1220020kb walltime=00:12:23
10/16/2007 00:51:40 cms008 Exit_status=0 cput=00:04:20 mem=679404kb vmem=994012kb walltime=00:06:56
22. 10. 2007 Good throughput of Physics data from FNAL
Good throughput from FNAL in the Prod PhEDEx instance, but with a high error rate. These "_TRANSFER error during TRANSFER phase_" only happen with downloads from FNAL and they seem not to affect the rate adversely, so probably no long timeouts that occupy FTS slots.There are almost always 16 CMS wan movers over the last two days. FNAL has the following settings for the FNAL-STAR FTS channel: Channel: FNAL-STAR Between: USCMS-FNAL-WC1 and * State: Active Contact: cms-team@fnal.gov Bandwidth: 0 Nominal throughput: 0 Number of files: 150, streams: 15 Number of VO shares: 3 VO 'dteam' share is: 1 VO 'ops' share is: 4 VO 'cms' share is: 95The files belong to the /store/CSA07/skim/2007/10/10/CSA07-CSA07AllEvents-Chowder-B2-PDAllEvents-Skims0 data sets.
SITE STATISTICS:
==================
                         first entry: 2007-10-21 22:55:37      last entry: 2007-10-22 10:51:57
site: T1_FNAL_Buffer (OK: 464   Err: 423   Exp/Canceled: 19)    succ. rate: 52.3 %   total: 753.3 GB
site: T1_FZK_Buffer (OK: 1   Err: 3   Exp/Canceled: 0)  succ. rate: 25.0 %   total: 1.2 GB

 *** ERRORS from T1_FNAL_Buffer:***
    224   Failed TRANSFER error during TRANSFER phase: [GENERAL_FAILURE]
    199   Failed TRANSFER error during TRANSFER phase: [GENERAL_FAILURE] at [date] state Done : all files requests have completed
     19   transfer expired in the download agent queue
Total downloads, including Debug instance:
SITE STATISTICS:
==================
                         first entry: 2007-10-21 22:45:54      last entry: 2007-10-22 10:40:42
site: T1_FNAL_Buffer (OK: 506   Err: 437   Exp/Canceled: 21)   succ. rate: 53.7 %   total: 878.0 GB
site: T1_FZK_Buffer (OK: 22   Err: 50   Exp/Canceled: 0)   succ. rate: 30.6 %   total: 53.1 GB
site: T1_IN2P3_Buffer (OK: 34   Err: 6   Exp/Canceled: 21)   succ. rate: 85.0 %   total: 84.1 GB
site: T1_RAL_Buffer (OK: 23   Err: 10   Exp/Canceled: 14)   succ. rate: 69.7 %   total: 63.9 GB


| I | Attachment | History | Action | Size | Date | Who | Comment |
|---|---|---|---|---|---|---|---|
| |
Dashboard.jpg | r1 | manage | 45.0 K | 2007-10-16 - 15:14 | DerekFeichtinger | |
| |
PHOENIX-fileservers-bytes_out.gif | r1 | manage | 17.9 K | 2007-10-16 - 14:52 | DerekFeichtinger | |
| |
fs-network.gif | r1 | manage | 15.9 K | 2007-10-16 - 14:50 | DerekFeichtinger | |
| |
running_mod.gif | r1 | manage | 24.0 K | 2007-10-16 - 15:05 | DerekFeichtinger | |
| |
storage01_movers_default.gif | r1 | manage | 17.4 K | 2007-10-16 - 15:27 | DerekFeichtinger | |
| |
wn-network.gif | r1 | manage | 14.2 K | 2007-10-16 - 14:51 | DerekFeichtinger | |
| |
wn29-load.gif | r1 | manage | 16.4 K | 2007-10-16 - 14:51 | DerekFeichtinger | |
| |
wn29-network.gif | r1 | manage | 12.9 K | 2007-10-16 - 14:52 | DerekFeichtinger |
Topic revision: r3 - 2007-10-22 - DerekFeichtinger

Ideas, requests, problems regarding TWiki? Send feedback