Throughput Tests with FNAL
These throughput tests were performed with the help of Matt Crawford and Mark Bowden from FNAL. The first few tests were done running iperf manually on Dec 1st 2006. On Dec 6 I tried to redo a full run with the help of my new script in an automated fashion, but the iperf service at FNAL ceased to work. An automated run using the new scripts was done on Jan 11th 2007 using another host. PS: There was a discussion on CMS hypernewsDec 1st 2006, charley.fnal.gov
Route, RTT and packet loss
traceroute to charley.fnal.gov (131.225.2.3), 30 hops max, 38 byte packets
 1  148.187.33.2 (148.187.33.2)  0.429 ms  0.441 ms  0.375 ms
 2  148.187.32.4 (148.187.32.4)  0.205 ms  0.228 ms  0.234 ms
 3  swima2.cscs.ch (148.187.20.2)  0.491 ms  0.595 ms  0.497 ms
 4  swiEL2-10GE-1-4.switch.ch (130.59.37.77)  3.453 ms  3.300 ms  3.202 ms
 5  swiCE3-10GE-1-3.switch.ch (130.59.37.65)  4.094 ms  4.216 ms  3.851 ms
 6  swiCE2-10GE-1-4.switch.ch (130.59.36.209)  4.092 ms  4.087 ms  4.110 ms
 7  switch.rt1.gen.ch.geant2.net (62.40.124.21)  4.093 ms  4.153 ms  4.112 ms
 8  so-7-2-0.rt1.fra.de.geant2.net (62.40.112.22)  12.218 ms  12.291 ms 12.231 ms
 9  esnet-wash-gw.rt1.fra.de.geant2.net (62.40.125.78)  118.081 ms  117.939 ms 117.997 ms
10  aoacr1-oc192-dccr1.es.net (134.55.219.46)  112.567 ms  112.513 ms  112.570 ms
11  chicr1-oc192-aoacr1.es.net (134.55.209.57)  132.696 ms  132.527 ms 132.570 ms
12  chislsdn1-chicr1.es.net (134.55.207.34)  132.683 ms  132.645 ms  132.571 ms
13  198.49.208.230 (198.49.208.230)  133.721 ms  133.812 ms  133.727 ms
14  vlan360.r-s-hub-fcc.fnal.gov (131.225.15.78)  133.982 ms  133.796 ms 133.852 ms
15  s-s-fapl.fnal.gov (131.225.15.29)  133.718 ms  137.085 ms  133.839 ms
16  charley.fnal.gov (131.225.2.3)  133.842 ms  133.921 ms  133.583 ms
The round trip time from an extended ping run was 133ms with 0 packet loss.
Influence of TCP window size and number of parallel streams
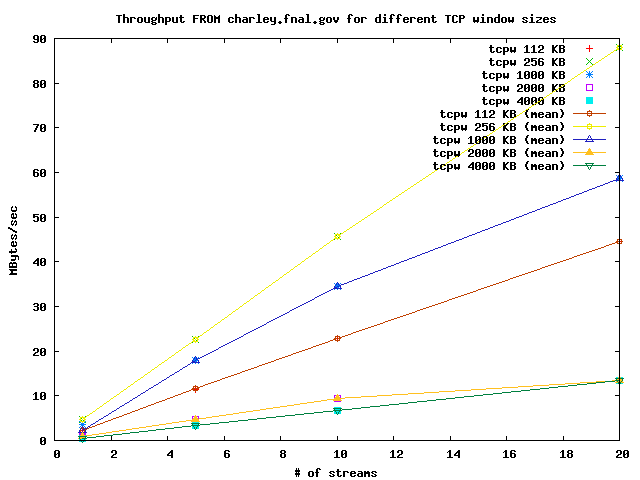
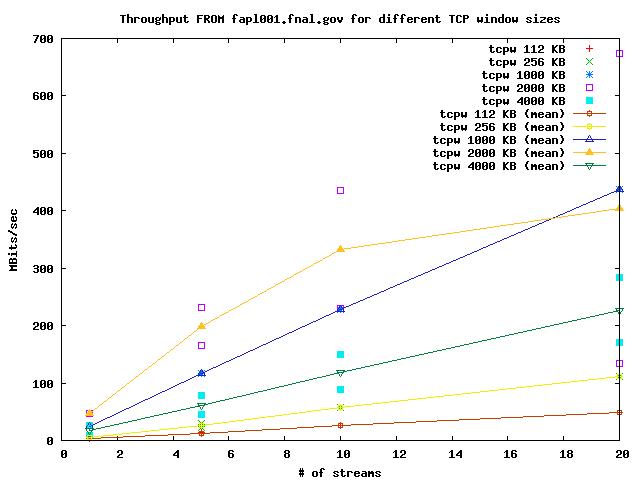
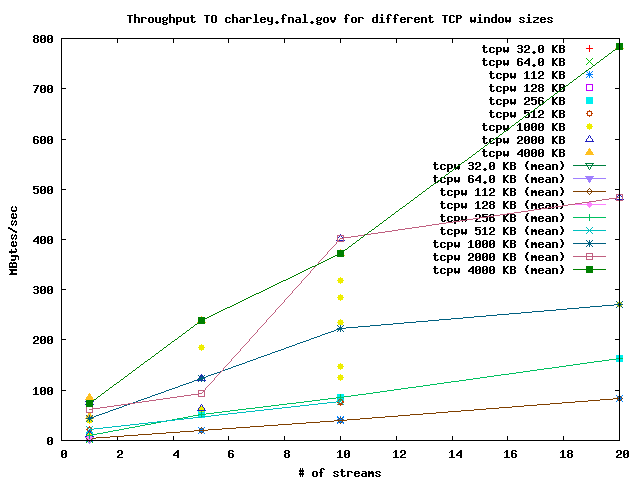
The upload graph (TO) looks ok and large TCP window sizes show huge improvements as is expected based on the large RTT of 133ms. The download graph shows up a major problem, because the rates are much too low. The best TCP window size of the series is 256KB and for all window sizes there is a linear increase of throughput with the number of streams. This points to a deeper problem (see below).
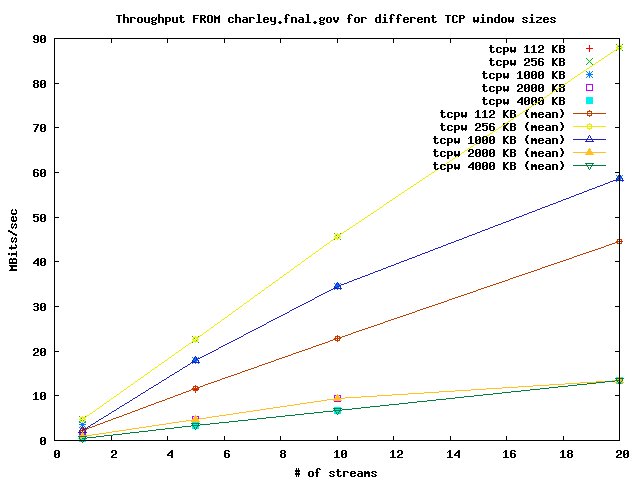
TCP based Problem for Downloads from FNAL (UNRESOLVED!)
This paragraph is based on a packet capture of aniperf run done with wireshark. The iperf
command line used was:
./iperf -c charley.fnal.gov -p [hidden] -w 1024k -r -L [hidden] -mThe CSCS->FNAL test shows correct behavior. The initial window size of 17920 at the fnal end rises to 1501696- and it seems that a big part of the window is also used. For the FNAL->CSCS test the TCP window grows from 8736 to 788384, which does not look too bad. but It seems that the window size is never really used: The typical behavior is:
I receive from FNAL 4 ACK packets of 1460 length in short intervals (~3ms), where the last packet also has the PSH flag set. Then, after ~75 ms, the CSCS side sends out an ACK. It seems that the other side is not sending anything until this ACK has been received. The next packet from fnal arrives after ~133ms (the normal round trip time). So, from the CSCS side it seems that the other side is never really using the available window (only 4*1460 bytes). Somehow, after sending a few packets, the other side is always waiting for an ACK from CSCS before continuing. My FNAL->CSCS capture also shows many more PSH,ACK packets than the CSCS->FNAL one. We need to get analysed captures done on the FNAL end to compare. It is not clear to me what is responsible for this kind of behavior, but it could well be that it's some network component between us.
Jan 11th 2007, fapl001.fnal.gov
Route, RTT and packet loss
traceroute to fapl001.fnal.gov (131.225.2.65), 30 hops max, 38 byte packets
 1  148.187.33.2 (148.187.33.2)  0.428 ms  0.449 ms  0.361 ms
 2  148.187.32.4 (148.187.32.4)  0.116 ms  0.102 ms  0.116 ms
 3  swima2.cscs.ch (148.187.20.2)  0.613 ms  0.473 ms  0.492 ms
 4  swiEL2-10GE-1-4.switch.ch (130.59.37.77)  3.114 ms  3.224 ms  3.240 ms
 5  swiCE3-10GE-1-3.switch.ch (130.59.37.65)  3.865 ms  4.102 ms  4.115 ms
 6  swiCE2-10GE-1-4.switch.ch (130.59.36.209)  4.114 ms  4.101 ms  3.989 ms
 7  switch.rt1.gen.ch.geant2.net (62.40.124.21)  4.113 ms  3.975 ms  4.115 ms
 8  so-7-2-0.rt1.fra.de.geant2.net (62.40.112.22)  12.359 ms  12.095 ms  12.106 ms
 9  esnet-wash-gw.rt1.fra.de.geant2.net (62.40.125.78)  104.172 ms  104.159 ms  104.171 ms
10  aoacr1-oc192-dccr1.es.net (134.55.219.46)  107.428 ms  107.523 ms  107.547 ms
11  chicr1-oc192-aoacr1.es.net (134.55.209.57)  127.658 ms  127.627 ms  127.538 ms
12  chislsdn1-chicr1.es.net (134.55.207.34)  127.501 ms  127.925 ms  127.978 ms
13  198.49.208.230 (198.49.208.230)  128.968 ms  128.713 ms  128.777 ms
14  vlan360.r-s-hub-fcc.fnal.gov (131.225.15.78)  128.652 ms  128.507 ms  128.534 ms
15  s-s-fapl.fnal.gov (131.225.15.29)  128.777 ms  135.675 ms  128.507 ms
16  fapl001.fnal.gov (131.225.2.65)  128.621 ms  128.725 ms  128.684 ms
The round trip time from an extended ping run was 128ms with 0 packet loss:
20 packets transmitted, 20 received, 0% packet loss, time 19197ms
rtt min/avg/max/mdev = 128.420/128.643/129.353/0.225 ms, pipe 2
Influence of TCP window size and number of parallel streams
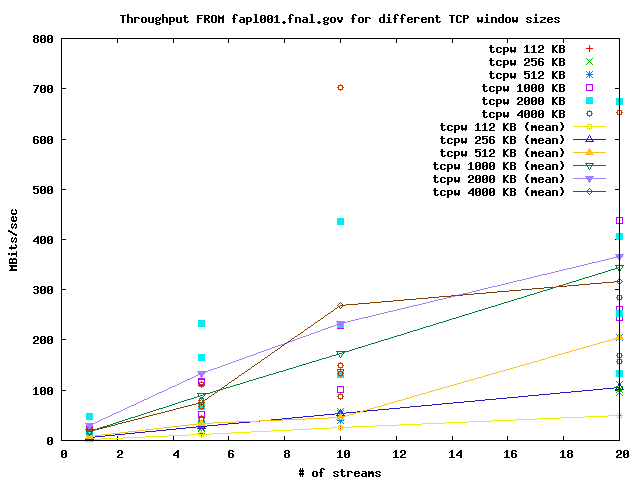
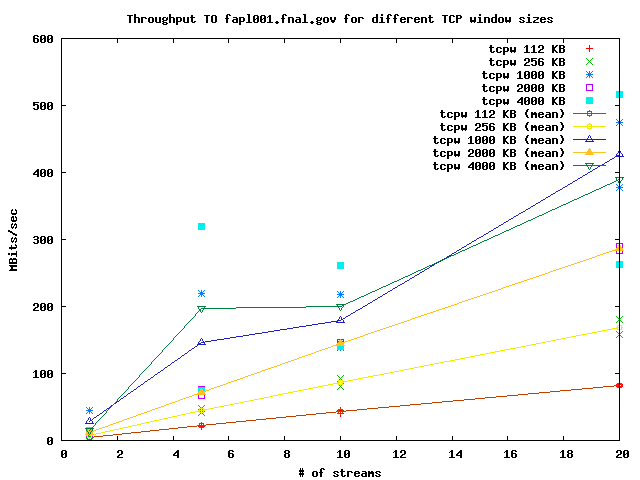
The tests with fapl001.fnal.gov give a much more consistent picture. Download and upload rates are of a comparable magnitude. The huge variations seen in these measurements are probably due to other traffic.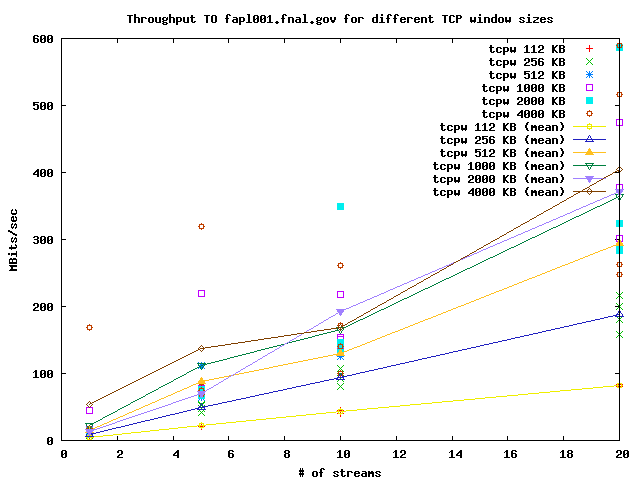
May 1st 2007, fapl001.fnal.gov
packet loss for route elements
Anmtr run showed
HOST                                    LOSS  RCVD SENT    BEST     AVG   WORST
148.187.33.2                              0%    30   30    0.36    0.46    0.80
148.187.32.4                              0%    30   30    0.10    0.20    0.46
swima2.cscs.ch                           10%    27   30    0.38    0.48    0.67
swiEL2-10GE-1-4.switch.ch                 4%    29   30    3.12    5.38   63.96
swiCE3-10GE-1-3.switch.ch                 0%    30   30    3.84    3.96    4.13
swiCE2-10GE-1-4.switch.ch                 0%    30   30    3.97    5.97   37.20
switch.rt1.gen.ch.geant2.net              0%    30   30    4.00    4.10    4.42
so-7-2-0.rt1.fra.de.geant2.net            0%    30   30   12.10   12.22   12.56
esnet-wash-gw.rt1.fra.de.geant2.net       0%    30   30  104.30  105.17  114.19
washsdn1-sdn2-washcr1.es.net              0%    30   30  104.42  115.45  271.71
chislmr1-washsdn1.es.net                  0%    30   30  122.05  128.71  250.88
chislsdn1-chislmr1.es.net                 0%    30   30  122.02  122.87  132.50
fnalmr1-chislsdn1.es.net                  0%    30   30  123.15  123.31  123.51
198.49.208.230                            0%    30   30  123.18  123.44  126.64
vlan360.r-s-hub-fcc.fnal.gov              0%    30   30  123.15  123.26  123.46
s-s-fapl.fnal.gov                         4%    29   30  123.21  123.40  123.97
fapl001.fnal.gov                          4%    29   30  123.10  123.27  123.59
-- DerekFeichtinger - 01 May 2007


| I | Attachment | History | Action |
Size | Date | Who | Comment |
|---|---|---|---|---|---|---|---|
| |
pIL-FROM-charley.fnal.gov.png | r2 r1 | manage | 7.0 K | 2006-12-10 - 21:20 | DerekFeichtinger | |
| |
pIL-FROM-fapl001.fnal.gov.png | r2 r1 | manage | 7.2 K | 2007-01-12 - 00:02 | DerekFeichtinger | |
| |
pIL-TO-charley.fnal.gov.png | r2 r1 | manage | 8.1 K | 2006-12-10 - 21:20 | DerekFeichtinger | |
| |
pIL-TO-fapl001.fnal.gov.png | r2 r1 | manage | 7.8 K | 2007-01-12 - 00:01 | DerekFeichtinger |
This topic: LCGTier2 > WebHome > CMSInfoPages > CMSSiteLog > CMSThroughputTests > ThroughputTestFNAL
Topic revision: r7 - 2007-05-01 - DerekFeichtinger
Ideas, requests, problems regarding TWiki? Send feedback