6. 6. 2008 Analysis Jobs reading at > 35 MB/s per Job from our Storage
~50 Jobs from Florian Bechtel managed to read with a total of ca. 1600 MB/s from our storage. This is a higher rate as we had seen from any other CMSSW based jobs. Florian reported that he was using CMSSW_2_0_7 running code fromQCDAnalysis/UEAnalysis with a configuration from QCDAnalysis/UEAnalysis/test/ueAnalysisRootFileChain.cfg.
Fileservers' and worker's network plots: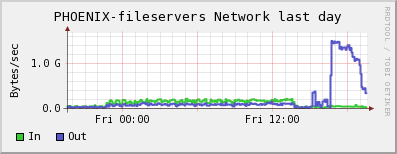
 dCache default (=dcap) movers plot showing the same curve:
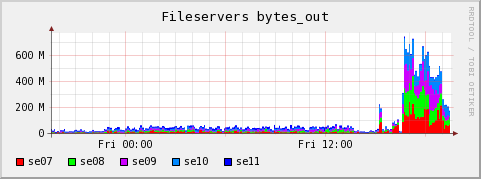
 Plots showing distribution of outwards traffic over fileservers:
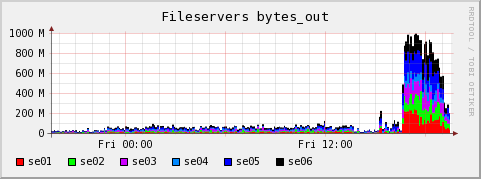
CE Log analysis
The gatekeeper shows 56 jobs having been accepted for Florian Bechtel as user cms022 between 16:34:25 and 16:40:45. However, the PBS accounting logs show that only 50 were started between 16:35:26 and 16:41:29, so 6 seem to have been rejected:PID: 17135 -- Notice: 5: "/C=DE/O=GermanGrid/OU=DESY/CN=Florian Bechtel" mapped to cms022 (18550/1399) $> grep "user=cms022" /var/spool/pbs/server_priv/accounting/20080606|grep -v "Exit_status"|wc -l 50Only 49 are recorded with an exit status, and all exited ok with Exit status
0:
$> grep "user=cms022" 20080606|grep "Exit_status"|wc -l
49
$> grep "user=cms022" 20080606|grep "Exit_status"|sed -e 's/.*\(Exit_status=[0-9]*\).*/\1/'|sort|uniq -c
     49 Exit_status=0
Job running time was distributed like this (minutes and seconds cut away by the sed expression):
$> grep "user=cms022" 20080606|grep "Exit_status"|sed -e 's/.*\(resources_used.walltime=[^:]*\).*/\1/'|sort|uniq -c
      4 resources_used.walltime=00
     11 resources_used.walltime=01
     30 resources_used.walltime=02
      4 resources_used.walltime=03
Two jobs almost finished immediately in the first 10 minutes, so we can assume that the load derived from ~47 jobs.
$> grep "user=cms022" 20080606|grep "Exit_status"|sed -ne 's/.*\(resources_used.walltime=00:[^:]*\).*/\1/p'|sort
resources_used.walltime=00:02
resources_used.walltime=00:06
resources_used.walltime=00:16
resources_used.walltime=00:37
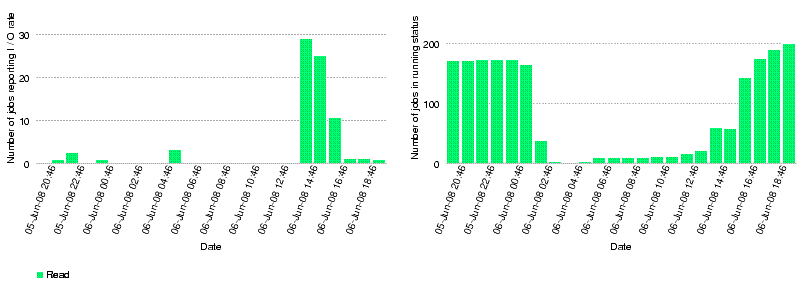
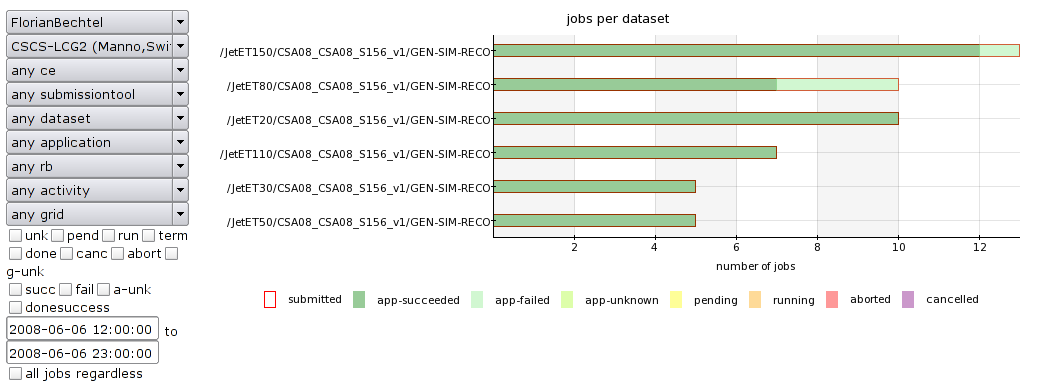
Comparison with I/O rate monitoring by CMS dashboard
The dashboard shows that at the peak rate less than 30 jobs were reporting I/O rates. The averaged I/O rates at that time were higher that 40 MB/s. If this is averaged over the reporting jobs (which is not totally clear from the page description), then the dashboard reports similar rates. Note that there is a 2h time difference between dashboard time and local time.
Further dashboard analysis
Link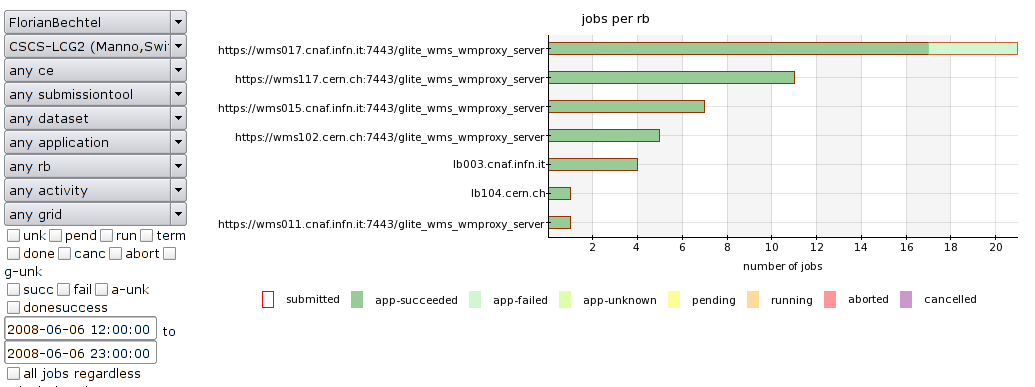


| I | Attachment | History | Action | Size | Date |
Who | Comment |
|---|---|---|---|---|---|---|---|
| |
PHOENIX-fileserversA-bytes_out-day.gif | r1 | manage | 18.9 K | 2008-06-07 - 07:38 | DerekFeichtinger | |
| |
PHOENIX-fileserversB-bytes_out-day.gif | r1 | manage | 17.0 K | 2008-06-07 - 07:39 | DerekFeichtinger | |
| |
dashboard-datasets.png | r1 | manage | 42.8 K | 2008-06-07 - 09:15 | DerekFeichtinger | |
| |
dashboard-rb.png | r1 | manage | 42.9 K | 2008-06-07 - 09:14 | DerekFeichtinger | |
| |
dashboardIO-avgread.png | r1 | manage | 5.0 K | 2008-06-07 - 09:01 | DerekFeichtinger | |
| |
dashboardIO-numjobs.png | r1 | manage | 5.5 K | 2008-06-07 - 09:01 | DerekFeichtinger | |
| |
fileservers-nw-report-20080606-1932-day.gif | r1 | manage | 14.8 K | 2008-06-07 - 07:35 | DerekFeichtinger | |
| |
movers_default-20080606-1932-day.gif | r1 | manage | 13.3 K | 2008-06-07 - 07:33 | DerekFeichtinger | |
| |
worker-nw-report-20080606-1932-day.gif | r1 | manage | 12.8 K | 2008-06-07 - 07:40 | DerekFeichtinger |
Topic revision: r1 - 2008-06-07 - DerekFeichtinger

Ideas, requests, problems regarding TWiki? Send feedback