Tags:
tag this topic
create new tag
view all tags
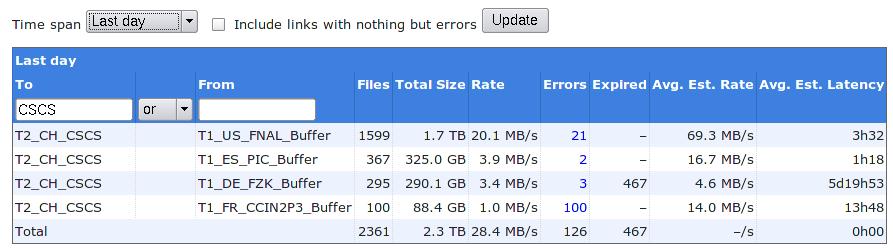
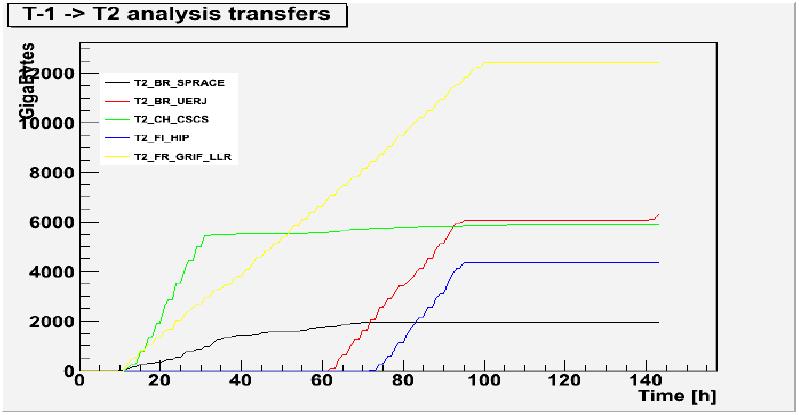
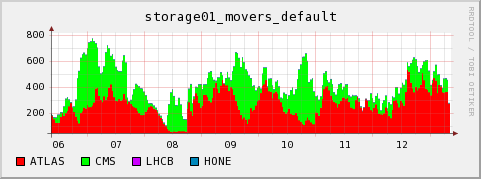
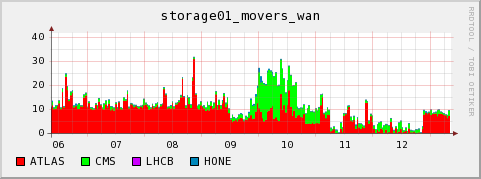
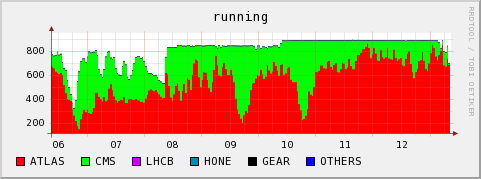
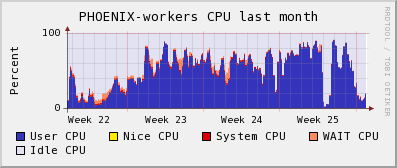
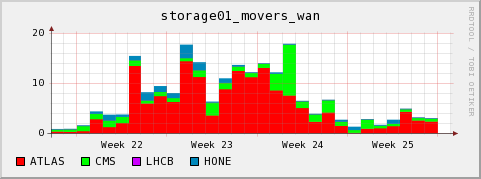
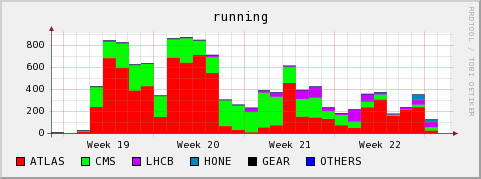
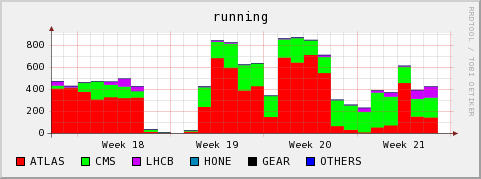
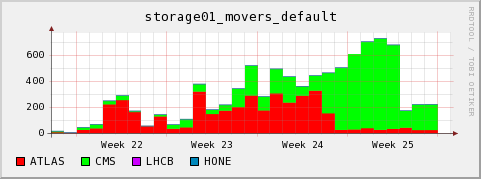
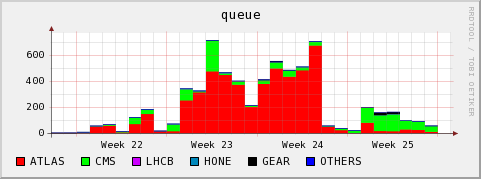
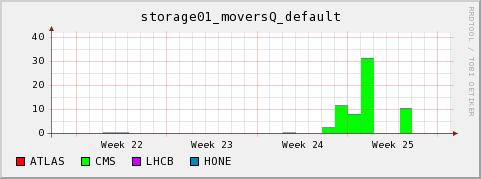
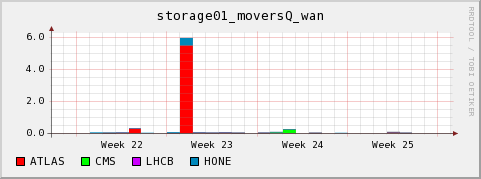
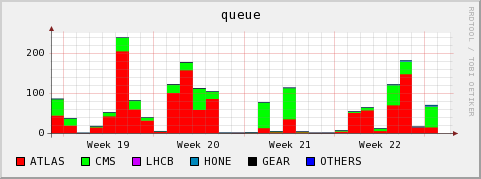
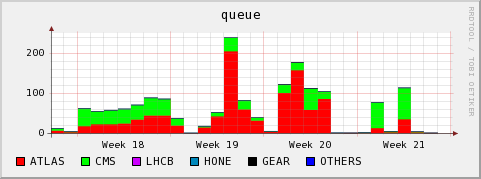
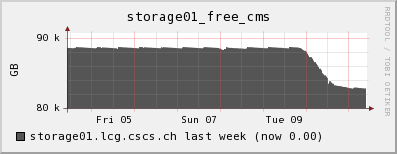
<!-- keep this as a security measure: * Set ALLOWTOPICCHANGE = Main.TWikiAdminGroup,Main.LCGAdminGroup * Set ALLOWTOPICRENAME = Main.TWikiAdminGroup,Main.LCGAdminGroup #uncomment this if you want the page only be viewable by the internal people # * Set ALLOWTOPICVIEW = Main.TWikiAdminGroup,Main.LCGAdminGroup --> %TOC% %ICON{arrowleft}% Go to [[CMSSiteLog13][previous page]] / [[CMSSiteLog15][next page]] of CMS site log %M% ---+ 25. 06. 2009 STEP09 ---++ Analysis exercises ---+++ Evaluation of the analysis exercise I would consider the exercise a success. In week 24 we got full load, and T2_CH_CSCS delivered 98% of the pledged slots, while also being under considerable load from ATLAS (though not from LHCb). Job failures due to the _site fail_ category are small, except for the night where 3 WNs died because of disk failures and acted as black holes. In week 25 we delivered 185% of the pledged resources, but at this time CMS was basically alone on the cluster. There were almost no ATLAS jobs (because of some flawed SAM tests, it seems we have been marked as down for 3 days. This certainly was not the case). We do not have much site fail entries, but there still are a lot of application and unknown failures, and since this varies a bit between centers, we need to understand what the reasons are. I have no clue at this moment. CPU efficiency of the CMS jobs was good, as could be told by local monitoring (see below). ATLAS jobs did have an efficiency problem, I think mostly because the did a lot of input file staging to local disk (all the files that a job needed!!! because of ganga framework). This ended up in overwhelming the network bandwidth of the WNs for these heavy multicore machines (16 cores per node, only 1Gb connection). Access to files by CMS over dcap was ok, with one exception when to0 many jobs wanted access in parallel to the JobRobot data sets (look below). This can be detected and alleviated by replication of the files over the cluster. But without a HSM behind dcache this replication must get triggered by hand. In respect to CE configuration, we still need to implement correct fair share between CMS prod and other (analysis) jobs. This is planned for the next downtime. ---+++ central monitoring Table entries taken from central [[https://twiki.cern.ch/twiki/bin/view/CMS/Step09AnalysisMetrics][T2 STEP09 analysis page]] Note: The low values for *Percentage of Analysis Pledge Used* have the primary reason of not enough jobs being sent. However, we should watch out for conditions where a VO cannot get their assigned resources in appreciable time. %TABLE{caption="Job Slot Usage"}% |*Week*|*Days Site Not Ready*|*Jobs Terminated*|*Avg Slots Used*|*Analysis Pledge*|*Percentage of Analysis Pledge Used (%)*|*CPU (sec)*|*WC (sec)*|*CPU/WC (%)*|*CPU Success (sec)*|*WC Success (sec)*|*CPU/WC Success (%)*|*CPU Success Rate (%)*|*WC Success Rate (%)*|*Avg Job (min)*| |19 |%RED%2%ENDCOLOR%| 2133| 35| 170| 20| 11926698| 21609030| 55| 10471281| 15066706| 69| 87| 69| 168| |20 |0| 5240| 34| 170| 20| 19932893| 21143856| 94| 15768291| 16587457| 95| 79| 78| 67| |21 |0| 4587| 28| 170| 16| 15348115| 17160032| 89| 14563797| 16222269| 89| 94| 94| 62| |22 |0| 5661| 27| 170| 15| 10913560| 16797031| 64| 10485177| 16149701| 64| 96| 96| 49| |23 |0| 8642| 111| 170| 65| 55876532| 67285766| 83| 54465292| 65531487| 83| 97| 97| 129| |24 |1| 13092| 168| 170| 98| 67627192| 102032006| 66| 62003189| 95844803| 64| 91| 93| 129| |25 |%RED%3%ENDCOLOR%| 20014| 316| 170| %GREEN%185%ENDCOLOR%| 163142897| 191311244| 85| 158617941| 184031306| 86| 97| 96| 159| %TABLE{caption="Breakdown of errors"}% |*Week*|*Days Not Ready*|*Jobs Terminated*|*Site Fail*|*App Fail*|*Unknown Fail*|*Success Rate (%)*| |19 |2| 2133| 0| 336| 267| 71| |20 |0| 5240| 9| 2399| 486| 44| |21 |0| 4587| 0| 630| 798| 68| |22 |0| 5661| 36| 1155| 1133| 58| |23 |0| 8642| 10| 861| 918| 79| |24 |1| 13092| 80| 1438| 607| 83| |25 |%RED%3%ENDCOLOR%| 20014| %GREEN%7%ENDCOLOR%| %RED%2701%ENDCOLOR%| %RED%1483%ENDCOLOR%| 79| ---+++ local monitoring Note: On Monday June 8 (beginning of week 24) I became aware of the local monitoring ignoring ATLAS pilot and nordugrid jobs. One can still derive the approx. number of jobs by looking whether there were any queued jobs at a time, and then assuming that the running job queue must have been filled to the top with these jobs (this assumption is almost always valid). ---++++ running jobs, queued jobs and CPU efficiency <img src="%ATTACHURLPATH%/running-20090623-1140-month.gif" alt="running-20090623-1140-month.gif" width='481' height='179' /> <img src="%ATTACHURLPATH%/queue-20090623-1140-month.gif" alt="queue-20090623-1140-month.gif" width='481' height='179' /> <br><img src="%ATTACHURLPATH%/workers-cpu-report-20090623-1140-month.gif" alt="workers-cpu-report-20090623-1140-month.gif" width='397' height='168' /> During week 22 we noticed two conditions disturbing the cluster * There were ATLAS jobs which did heavy prestaging of files from the SE to the WN using dccp. Many nodes ended up with massive I/O wait due to the many dccp processes fighting for the bandwidth and the access to the local scratch space. * ATLAS then shifted away from using dccp, afterwards seemingly using direct dcap. It seems to me that this is still a strange theoretical payload. The ratio of I/O to CPU is excessive. * An ATLAS user had reserved 16CPUs for his jobs, without actually making use of them. This blocked the queue and is the explanation for the queued jobs in the above graphs despite only a subset of our actual cores being taken. ---++++ Number of active and queued dcap (=default) movers <img src="%ATTACHURLPATH%/movers_default-20090623-1140-month.gif" alt="movers_default-20090623-1140-month.gif" width='481' height='179' /> <img src="%ATTACHURLPATH%/queued_movers_default-20090623-1140-month.gif" alt="queued_movers_default-20090623-1140-month.gif" width='481' height='179' /> ---++++ Number of active and queued and gsiftp (=wan) movers <img src="%ATTACHURLPATH%/movers_wan-20090623-1140-month.gif" alt="movers_wan-20090623-1140-month.gif" width='481' height='179' /> <br><img src="%ATTACHURLPATH%/queued_movers_wan-20090623-1140-month.gif" alt="queued_movers_wan-20090623-1140-month.gif" width='481' height='179' /> ---++ Data transfers ---+++ Evaluation of the transfer exercise This is based on the monitoring, below. First day: Very nice high quality throughput from FNAL. In the first 12 h I had avg. speed of about 70 MB/s. Problems with IN2P3 (their SE had an error which failed half of the transfers). No Files at all from our dedicated T1 at FZK??? Second day: Still good transfers from FNAL, albeit somewhat slower. One big set finished. Some files from FZK, but at slow speed (~5 MB/s on avg.). Still about 50% failures from IN2P3, a big fraction still with the "gsiftp protocol not supported" error. Sixth day: *It is a cause of concern that the troughput from our primary T1 at FZK is so low.* Even after 6 days, only 12% of the files are at CSCS. The best latency/throughput we had over the ocean from FNAL. I would consider the exercise successful in respect to the tools we have, but a failure in relation to the stability of the transfers for some T1s. A graph presented by Stephano Belforte in the [[http://indico.cern.ch/conferenceDisplay.py?confId=62300&view=standard&showDate=23-June-2009&showSession=all&detailLevel=contribution][STEP'09 Analysis meeting of 2009-06-23]] shows CSCS as a _normal_ site in relation to transfers. T2_DE_RWTH and T2_US_Caltech were shown as _fast_ sites. However, since RWTH also has the T1_DE_FZK as primary Tier-1 and all our troubles came from there (while all the good transfers came from FNAL), I wonder why there seems to be such a difference. <img src="%ATTACHURLPATH%/transfers-t1t2-step09-belforte.jpg" alt="transfers-t1t2-step09-belforte.jpg" width='799' height='415' /> ---+++ ordered datasets and simple latency observations I approved the following two requests on 2009-06-10, 19:45: [[https://cmsweb.cern.ch/phedex/prod/Request::View?request=51292][Request 51292]] |Data Level | Data Item | SRC | Files | Size | 06/10 15:25h | 06/11 9:20h | 06/11 18:30h | 06/16 22:10h | |Dataset | /Wc-madgraph/Fall08_IDEAL_V9_v1/GEN-SIM-RAW | T1_DE_FZK | 3254 | 3.13 TB | 0 | 294 (289.1GB) | 303 (297.9GB) | 904 (889.4GB) | |Dataset | /Wc-madgraph/Fall08_IDEAL_V11_redigi_v1/GEN-SIM-RAW | T1_DE_FZK | 3156 | 3.01 TB | 0 | 0 | 0 | 497 (485.8GB) | [[https://cmsweb.cern.ch/phedex/prod/Request::View?request=51297][Request 51297]] |Data Level | Data Item | Files | Size | SRC | 06/10 9:40h | 06/10 15:25h | 06/11 9:20h | 06/11 18:30h | |Dataset | /QCD100to250-madgraph/Fall08_IDEAL_V11_redigi_v1/GEN-SIM-RECO | T1_US_FNAL | 4099 | 4.26 TB | 2505 (2.6 TB) | 3718 (3.9TB) | 4099 (4.3TB) | - | |Dataset | /InclusivePPmuX/Summer08_IDEAL_V11_redigi_v1/GEN-SIM-RECO | T1_ES_PIC, T1_FR_CCIN2P3, | 1702 | 1.47 TB | 878 (0.7TB) | 1255 (1.1TB) | 1326 (1.1TB) | 1346 (1.2TB) | * Note: The SRC column shows the sites with direct links to T2_CH_CSCS that DBS marks as having the sets. ---+++ Phedex central monitoring Phedex central monitoring for last day (taken on 2009-06-11 9:25h): <img src="%ATTACHURLPATH%/transfers-step09-06-11.jpg" alt="transfers-step09-06-11.jpg" width='893' height='249' /> ---+++ My own local phedex monitoring: <img src="%ATTACHURLPATH%/storage_free_cms_20090611.jpg" alt="storage_free_cms_20090611.jpg" width='397' height='154' /> Error message statistics per site:%TWISTY{showlink="Show" hidelink="Hide" showimgleft="%ICONURLPATH{toggleopen-small}%" hideimgleft="%ICONURLPATH{toggleclose-small}%"}%<pre> =================================== *** ERRORS from T1_ES_PIC_Buffer:*** 6 TRANSFER error during TRANSFER phase: [GRIDFTP_ERROR] globus_ftp_client: the server responded with an error 426 Transfer aborted (Transfer failed: Connection timed out) *** ERRORS from T1_FR_CCIN2P3_Buffer:*** 480 SOURCE error during TRANSFER_PREPARATION phase: [GENERAL_FAILURE] Protocol(s) specified not supported: [ gsiftp ] 8 SOURCE error during TRANSFER_PREPARATION phase: [REQUEST_TIMEOUT] failed to prepare source file in 180 seconds 2 SOURCE error during TRANSFER phase: [GRIDFTP_ERROR] an end-of-file was reached globus_xio: An end of file occurred (possibly the destination disk is full) 2 SOURCE error during TRANSFER phase: [TRANSFER_TIMEOUT] globus_ftp_client_size: Connection timed out *** ERRORS from T1_US_FNAL_Buffer:*** 9 TRANSFER error during TRANSFER phase: [GRIDFTP_ERROR] globus_ftp_client: the server responded with an error 426 Transfer aborted (Unexpected Exception : org.dcache.ftp.FTPException: Stream ended before EOD/Data channel was closed before EOD marker) 3 SOURCE error during TRANSFER phase: [GRIDFTP_ERROR] globus_xio: Unable to connect to cmsstor68.fnal.gov:2811 globus_xio: System error in connect: Connection refused globus_xio: A system call failed: Connection refused 2 TRANSFER error during TRANSFER phase: [GRIDFTP_ERROR] an end-of-file was reached globus_xio: An end of file occurred (possibly the destination disk is full) 1 TRANSFER error during TRANSFER phase: [GRIDFTP_ERROR] globus_ftp_client: the server responded with an error 426 Transfer aborted (Transfer failed: Connection reset by peer) </pre> %ENDTWISTY% <pre> SITE STATISTICS: ================== first entry: 2009-06-09 07:37:07 last entry: 2009-06-10 07:36:12 T1_ES_PIC_Buffer (OK: 190 Err: 6 Exp: 0 Canc: 0 Lost: 0) succ.: 96.9 % total: 180.5 GB ( 2.1 MB/s) T1_FR_CCIN2P3_Buffer (OK: 688 Err: 492 Exp: 0 Canc: 0 Lost: 0) succ.: 58.3 % total: 652.5 GB ( 7.6 MB/s) T1_US_FNAL_Buffer (OK: 2525 Err: 15 Exp: 0 Canc: 0 Lost: 0) succ.: 99.4 % total: 2895.0 GB (33.5 MB/s) TOTAL SUMMARY: ================== first entry: 2009-06-09 07:37:07 last entry: 2009-06-10 07:36:12 total transferred: 3472.0 GB in 24.0 hours avg. total rate: 41.2 MB/s = 329.4 Mb/s = 3474.2 GB/day </pre> Error message statistics per site:%TWISTY{showlink="Show" hidelink="Hide" showimgleft="%ICONURLPATH{toggleopen-small}%" hideimgleft="%ICONURLPATH{toggleclose-small}%"}%<pre> =================================== *** ERRORS from T1_DE_FZK_Buffer:*** 2 SOURCE error during TRANSFER phase: [TRANSFER_TIMEOUT] globus_ftp_client_size: Connection timed out 1 TRANSFER error during TRANSFER phase: [GRIDFTP_ERROR] globus_xio: System error in read: Connection reset by peer globus_xio: A system call failed: Connection reset by peer *** ERRORS from T1_ES_PIC_Buffer:*** 1 TRANSFER error during TRANSFER phase: [GRIDFTP_ERROR] globus_ftp_client: the server responded with an error 426 Transfer aborted (Transfer failed: Connection timed out) *** ERRORS from T1_FR_CCIN2P3_Buffer:*** 35 SOURCE error during TRANSFER phase: [GRIDFTP_ERROR] an end-of-file was reached globus_xio: An end of file occurred (possibly the destination disk is full) 20 SOURCE error during TRANSFER_PREPARATION phase: [GENERAL_FAILURE] Protocol(s) specified not supported: [ gsiftp ] 5 SOURCE error during TRANSFER_PREPARATION phase: [REQUEST_TIMEOUT] failed to prepare source file in 180 seconds *** ERRORS from T1_US_FNAL_Buffer:*** 9 error during phase: [] 7 TRANSFER error during TRANSFER phase: [GRIDFTP_ERROR] an end-of-file was reached globus_xio: An end of file occurred (possibly the destination disk is full) 5 TRANSFER error during TRANSFER phase: [GRIDFTP_ERROR] globus_ftp_client: the server responded with an error 426 Transfer aborted (Unexpected Exception : org.dcache.ftp.FTPException: Stream ended before EOD/Data channel was closed before EOD marker) </pre> %ENDTWISTY% <pre> SITE STATISTICS: ================== first entry: 2009-06-10 07:35:51 last entry: 2009-06-11 07:35:22 T1_DE_FZK_Buffer (OK: 295 Err: 3 Exp: 0 Canc: 0 Lost: 0) succ.: 99.0 % total: 311.5 GB ( 3.6 MB/s) T1_ES_PIC_Buffer (OK: 348 Err: 1 Exp: 0 Canc: 0 Lost: 0) succ.: 99.7 % total: 331.3 GB ( 3.8 MB/s) T1_FR_CCIN2P3_Buffer (OK: 100 Err: 60 Exp: 0 Canc: 0 Lost: 0) succ.: 62.5 % total: 94.9 GB ( 1.1 MB/s) T1_US_FNAL_Buffer (OK: 1594 Err: 21 Exp: 0 Canc: 0 Lost: 0) succ.: 98.7 % total: 1814.1 GB (21.0 MB/s) TOTAL SUMMARY: ================== first entry: 2009-06-10 07:35:51 last entry: 2009-06-11 07:35:22 total transferred: 2376.5 GB in 24.0 hours avg. total rate: 28.2 MB/s = 225.4 Mb/s = 2377.3 GB/day </pre> Note: Measurement for first 12 hours showing high rates with top quality from FNAL. %TWISTY{showlink="Show" hidelink="Hide" showimgleft="%ICONURLPATH{toggleopen-small}%" hideimgleft="%ICONURLPATH{toggleclose-small}%"}%<pre> SITE STATISTICS: ================== first entry: 2009-06-09 19:00:32 last entry: 2009-06-10 07:00:32 T1_CH_CERN_Buffer (OK: 8 Err: 0 Exp: 0 Canc: 0 Lost: 0) succ.: 100.0 % total: 21.5 GB ( 0.5 MB/s) T1_ES_PIC_Buffer (OK: 105 Err: 2 Exp: 0 Canc: 0 Lost: 0) succ.: 98.1 % total: 113.5 GB ( 2.6 MB/s) T1_FR_CCIN2P3_Buffer (OK: 671 Err: 422 Exp: 0 Canc: 0 Lost: 0) succ.: 61.4 % total: 645.7 GB (14.9 MB/s) T1_IT_CNAF_Buffer (OK: 6 Err: 0 Exp: 0 Canc: 0 Lost: 0) succ.: 100.0 % total: 16.1 GB ( 0.4 MB/s) T1_TW_ASGC_Buffer (OK: 8 Err: 2 Exp: 0 Canc: 0 Lost: 0) succ.: 80.0 % total: 22.5 GB ( 0.5 MB/s) T1_UK_RAL_Buffer (OK: 8 Err: 0 Exp: 0 Canc: 0 Lost: 0) succ.: 100.0 % total: 22.3 GB ( 0.5 MB/s) T1_US_FNAL_Buffer (OK: 2412 Err: 15 Exp: 0 Canc: 0 Lost: 0) succ.: 99.4 % total: 2803.3 GB (64.9 MB/s) T2_DE_RWTH (OK: 0 Err: 0 Exp: 37 Canc: 0 Lost: 0) total: 0.0 GB ( 0.0 MB/s) TOTAL SUMMARY: ================== first entry: 2009-06-09 19:00:32 last entry: 2009-06-10 07:00:32 total transferred: 3394.5 GB in 12.0 hours avg. total rate: 80.5 MB/s = 643.7 Mb/s = 6789.1 GB/day </pre> %ENDTWISTY% ---++ Events happening on the cluster ---+++ 2009-05-20/21 SRM queue overfilled by thousands of GET requests from ATLAS jobs Jobs from two users (one is from the ATLAS central operations responsible for the STEP09 HammerCloud pre-tests) caused the SRM queue to grow by several jobs a second. In the SRM-storage01 cell we had to put maxReadyJobs=3000 to keep the site up for the meantime. One user we had to ban temporarily, until Hurng-Chun Lee from ATLAS traced back the problem to a python routine trying to calculate the adler32 checksum by reading in the full file into a python string (and overstepping the python boundary on these systems), therby hanging the system in a bad way. This was corrected. ---+++ 2009-05-29 ATLAS heavy staging to local disc by dccp impacts cluster We saw heavy dcap activity and many CPUs with significant I/O wait states. Some nodes actually became unresponsive. This was traced back to multiple dccp processes running on every node and writing to local disk. dccp is used to copy whole files per dcap from the SE, so ATLAS seems to follow a model where they first stage the whole file to local disk. However, our cluster is laid out for analysis jobs to read directly via dcap from the storage. This was not a problem, before, because like many dcache sites we limit the gridftp transfers to a few per pool, because these do high efficiency sequential reads which are more efficient when scheduled sequentially. We allow many more dcap movers in the assumption that jobs using these usually will keep open the filehandle for reading sparsely. But if people use dccp for staging, they get the dcap mover limit, resulting in a max of 100 movers per pool in our configuration!!! Todays nodes tend to have more and more cores and less disks per core (our current cluster has blade nodes with 16 cores, but only one scratch disk - certainly not ideal). It is bad policy to have many jobs stage files locally, which thereafter are maybe read sparsely. Also, it is bad if all kinds of jobs stage the identical files to local disk. Also, it seemed to me that the ganga robot staged all the files for the whole job at the beginning instead of getting one, processing one, and then getting the next. After contacting ATLAS (Johannes Elmsheuser and Hurn-Chun Lee) they disabled the usage of dccp in Ganga. Over the next days we still saw high numbers of dcacp movers and I/O wait on nodes running ATLAS jobs, but seemingly this was now truly using dcap internally. Still, it seems that the jobs have very low processing in comparison to I/O (maybe almost empty loops over events?). Never seen that in CMS jobs up to now. Disruptive to the efficiency of the cluster. If these are real payloads, we need to reconsider the design of the cluster. Our monitoring points to pilot jobs being the most troublesome (may also be nordugrid). ---+++ 2009-06-07/08 Three WNs acting as black holes during the night Three nodes went down with disk failures. Unluckily the batch system still considered them as eligible. Here we see a design weakness in our cluster. We have 16 cores per blade node, but only two disks. One disk is for the OS, while there is only one scratch disk. Especially in a mode where all jobs seem to do heavy staging to local disk (like the ATLAS jobs we see), the disks are exercised to their limit. We will try to repair these deficiencies in the next upgrade which is under planning, now. The CMS SAM tests marked our CE as down during the night from June 07/08, which also is shown in the tables above (week 24). ---+++ 2009-06-13 more than 100 dcap movers for a CMS pool We currently allow 100 dcap transfers per pool. about 125 mover were accessing se04_cms around 17h, so some of them got queued. I set the max value for this pool to 125. Let's see whether the pool can take that. May be better to look at replication. This output shows the number of dcache movers and to which pnfs IDs they are connected. Below is a list mapping these IDs to files. <pre> wget -O- -q http://storage01.lcg.cscs.ch:2288/context/transfers.txt | grep se04_cms | awk '{print $7}' |sort | uniq -c 20 000200000000000001CAFFC8 2 000200000000000001CBBDD0 29 000200000000000001CBBF48 2 000200000000000001CBC370 3 000200000000000001CBC388 26 000200000000000001CBC628 34 000200000000000001CBC930 2 000200000000000002364A20 3 000200000000000002364DB8 3 000200000000000002365948 wget -O- -q http://storage01.lcg.cscs.ch:2288/context/transfers.txt | grep se04_cms | awk '{print $7}' |sort | uniq |dc_get_pnfsname_from_IDlist.sh 000200000000000001CAFFC8 /pnfs/lcg.cscs.ch/cms/trivcat/store/mc/SAM/QCD_pt_0_15/GEN-SIM-RAW-RECO/IDEAL_V9_SAM/0000/8C1E14E9-AFA5-DD11-ACFE-00163E1124AF.root 000200000000000001CBBDD0 /pnfs/lcg.cscs.ch/cms/trivcat/store/mc/JobRobot/QCD_pt_0_15/GEN-SIM-RAW-RECO/IDEAL_V9_JobRobot/0000/F409AC0C-E1A1-DD11-AAC6-001560AD12EE.root 000200000000000001CBBF48 /pnfs/lcg.cscs.ch/cms/trivcat/store/mc/JobRobot/QCD_pt_0_15/GEN-SIM-RAW-RECO/IDEAL_V9_JobRobot/0000/34F8B258-E7A1-DD11-9838-001560AC4F10.root 000200000000000001CBC370 /pnfs/lcg.cscs.ch/cms/trivcat/store/mc/JobRobot/QCD_pt_0_15/GEN-SIM-RAW-RECO/IDEAL_V9_JobRobot/0000/86286B55-E7A1-DD11-A289-001560ADE172.root 000200000000000001CBC388 /pnfs/lcg.cscs.ch/cms/trivcat/store/mc/JobRobot/QCD_pt_0_15/GEN-SIM-RAW-RECO/IDEAL_V9_JobRobot/0000/F055791D-E3A1-DD11-AA2B-00163E1124EA.root 000200000000000001CBC628 /pnfs/lcg.cscs.ch/cms/trivcat/store/mc/JobRobot/QCD_pt_0_15/GEN-SIM-RAW-RECO/IDEAL_V9_JobRobot/0000/AE7BCA72-3FA2-DD11-A5B7-001560AC1D24.root 000200000000000001CBC930 /pnfs/lcg.cscs.ch/cms/trivcat/store/mc/JobRobot/QCD_pt_0_15/GEN-SIM-RAW-RECO/IDEAL_V9_JobRobot/0000/3E7CFF36-E8A1-DD11-95E1-001560AC4F10.root 000200000000000002364A20 /pnfs/lcg.cscs.ch/cms/trivcat/store/mc/Summer08/SUSY_LM0-sftsht/GEN-SIM-RECO/IDEAL_V11_v1/0008/A2D62968-0CF0-DD11-9CE8-001A645C6712.root 000200000000000002364DB8 /pnfs/lcg.cscs.ch/cms/trivcat/store/mc/Summer08/SUSY_LM0-sftsht/GEN-SIM-RECO/IDEAL_V11_v1/0008/AAA8D3FE-65EF-DD11-B476-00163E1124D5.root 000200000000000002365948 /pnfs/lcg.cscs.ch/cms/trivcat/store/mc/Summer08/SUSY_LM0-sftsht/GEN-SIM-RECO/IDEAL_V11_v1/0009/A0543581-09F3-DD11-BDB1-001A6459335E.root </pre> ---+++ 2009-06-16 again queued dcap movers for CMS The storage pools are overwhelmed by too many parallel requests for the same files, ending up in more than 100 movers per pool. A look at the details (below) shows that all files in high demand belong to these two data sets: * */QCD_pt_0_15/JobRobot_IDEAL_V9_JobRobot/GEN-SIM-RAW-RECO* * */QCD_pt_0_15/SAM_IDEAL_V9_SAM/GEN-SIM-RAW-RECO* These data sets are used for testing and artificial load by JobRobot, etc. For normal job loads it is improbable for our cluster size that we will often come into such an overload situation, because not all jobs will want to access the same files. We should replicate these two data sets. List of active files: %TWISTY{showlink="Show" hidelink="Hide" showimgleft="%ICONURLPATH{toggleopen-small}%" hideimgleft="%ICONURLPATH{toggleclose-small}%"}%<pre> 49 000200000000000001CBC930 se04_cms /pnfs/lcg.cscs.ch/cms/trivcat/store/mc/JobRobot/QCD_pt_0_15/GEN-SIM-RAW-RECO/IDEAL_V9_JobRobot/0000/3E7CFF36-E8A1-DD11-95E1-001560AC4F10.root 46 000200000000000001CBC070 se06_cms /pnfs/lcg.cscs.ch/cms/trivcat/store/mc/JobRobot/QCD_pt_0_15/GEN-SIM-RAW-RECO/IDEAL_V9_JobRobot/0000/960DFDBC-3EA2-DD11-B6D9-001560AC1D24.root 46 000200000000000001CBBF48 se04_cms /pnfs/lcg.cscs.ch/cms/trivcat/store/mc/JobRobot/QCD_pt_0_15/GEN-SIM-RAW-RECO/IDEAL_V9_JobRobot/0000/34F8B258-E7A1-DD11-9838-001560AC4F10.root 45 000200000000000001CBCB10 se03_cms /pnfs/lcg.cscs.ch/cms/trivcat/store/mc/JobRobot/QCD_pt_0_15/GEN-SIM-RAW-RECO/IDEAL_V9_JobRobot/0000/46536CE4-E9A1-DD11-854A-001560AC2FD8.root 44 000200000000000001CBBEB8 se11_cms /pnfs/lcg.cscs.ch/cms/trivcat/store/mc/JobRobot/QCD_pt_0_15/GEN-SIM-RAW-RECO/IDEAL_V9_JobRobot/0000/1A7CEA63-E5A1-DD11-9188-001560AC7E98.root 44 000200000000000001CBBDE0 se07_cms /pnfs/lcg.cscs.ch/cms/trivcat/store/mc/JobRobot/QCD_pt_0_15/GEN-SIM-RAW-RECO/IDEAL_V9_JobRobot/0000/C01E25C9-3DA2-DD11-9354-001560AC7E98.root 43 000200000000000001CBC300 se05_cms /pnfs/lcg.cscs.ch/cms/trivcat/store/mc/JobRobot/QCD_pt_0_15/GEN-SIM-RAW-RECO/IDEAL_V9_JobRobot/0000/A48D5963-E5A1-DD11-83B5-001560AC7E98.root 41 000200000000000001CBC628 se04_cms /pnfs/lcg.cscs.ch/cms/trivcat/store/mc/JobRobot/QCD_pt_0_15/GEN-SIM-RAW-RECO/IDEAL_V9_JobRobot/0000/AE7BCA72-3FA2-DD11-A5B7-001560AC1D24.root 39 000200000000000001CBBE50 se05_cms /pnfs/lcg.cscs.ch/cms/trivcat/store/mc/JobRobot/QCD_pt_0_15/GEN-SIM-RAW-RECO/IDEAL_V9_JobRobot/0000/9EF7D9E3-E9A1-DD11-A217-001560AD4140.root 32 000200000000000001CAFEF8 se06_cms /pnfs/lcg.cscs.ch/cms/trivcat/store/mc/SAM/QCD_pt_0_15/GEN-SIM-RAW-RECO/IDEAL_V9_SAM/0000/A82F9385-A3A5-DD11-B03E-00163E1124E9.root 31 000200000000000001CAFFB0 se11_cms /pnfs/lcg.cscs.ch/cms/trivcat/store/mc/SAM/QCD_pt_0_15/GEN-SIM-RAW-RECO/IDEAL_V9_SAM/0000/BCC46CCA-A4A5-DD11-9CB5-001560AC1D24.root 31 000200000000000001CAFF08 se03_cms /pnfs/lcg.cscs.ch/cms/trivcat/store/mc/SAM/QCD_pt_0_15/GEN-SIM-RAW-RECO/IDEAL_V9_SAM/0000/2C556CAE-ACA5-DD11-A6C7-00163E11248E.root 30 000200000000000001CB0010 se11_cms /pnfs/lcg.cscs.ch/cms/trivcat/store/mc/SAM/QCD_pt_0_15/GEN-SIM-RAW-RECO/IDEAL_V9_SAM/0000/5A50C03F-ADA5-DD11-9FE8-00163E11247A.root 30 000200000000000001CAFEE8 se06_cms /pnfs/lcg.cscs.ch/cms/trivcat/store/mc/SAM/QCD_pt_0_15/GEN-SIM-RAW-RECO/IDEAL_V9_SAM/0000/5E326586-A4A5-DD11-A6AA-0015600E3ECA.root 30 000200000000000001CAFEC0 se07_cms /pnfs/lcg.cscs.ch/cms/trivcat/store/mc/SAM/QCD_pt_0_15/GEN-SIM-RAW-RECO/IDEAL_V9_SAM/0000/806CD613-AEA5-DD11-8795-00163E112499.root 29 000200000000000001CAFFC8 se04_cms /pnfs/lcg.cscs.ch/cms/trivcat/store/mc/SAM/QCD_pt_0_15/GEN-SIM-RAW-RECO/IDEAL_V9_SAM/0000/8C1E14E9-AFA5-DD11-ACFE-00163E1124AF.root 29 000200000000000001CAFED8 se10_cms /pnfs/lcg.cscs.ch/cms/trivcat/store/mc/SAM/QCD_pt_0_15/GEN-SIM-RAW-RECO/IDEAL_V9_SAM/0000/94AD82A3-AEA5-DD11-9E95-00163E11247A.root 28 000200000000000001CB0048 se07_cms /pnfs/lcg.cscs.ch/cms/trivcat/store/mc/SAM/QCD_pt_0_15/GEN-SIM-RAW-RECO/IDEAL_V9_SAM/0000/F21EB2B6-ABA5-DD11-87D5-00163E11247C.root 27 000200000000000001CB0040 se02_cms /pnfs/lcg.cscs.ch/cms/trivcat/store/mc/SAM/QCD_pt_0_15/GEN-SIM-RAW-RECO/IDEAL_V9_SAM/0000/18A1B60B-A5A5-DD11-84FC-00163E1124E2.root 7 000200000000000001CBC388 se04_cms /pnfs/lcg.cscs.ch/cms/trivcat/store/mc/JobRobot/QCD_pt_0_15/GEN-SIM-RAW-RECO/IDEAL_V9_JobRobot/0000/F055791D-E3A1-DD11-AA2B-00163E1124EA.root 6 000200000000000001CBBF70 se06_cms /pnfs/lcg.cscs.ch/cms/trivcat/store/mc/JobRobot/QCD_pt_0_15/GEN-SIM-RAW-RECO/IDEAL_V9_JobRobot/0000/BE6AC624-E3A1-DD11-A3B2-001560AC7E98.root 5 000200000000000001CBC528 se11_cms /pnfs/lcg.cscs.ch/cms/trivcat/store/mc/JobRobot/QCD_pt_0_15/GEN-SIM-RAW-RECO/IDEAL_V9_JobRobot/0000/1AE459A2-DEA1-DD11-AA50-00163E1124CD.root 5 000200000000000001CBC370 se04_cms /pnfs/lcg.cscs.ch/cms/trivcat/store/mc/JobRobot/QCD_pt_0_15/GEN-SIM-RAW-RECO/IDEAL_V9_JobRobot/0000/86286B55-E7A1-DD11-A289-001560ADE172.root 5 000200000000000001CBBF08 se07_cms /pnfs/lcg.cscs.ch/cms/trivcat/store/mc/JobRobot/QCD_pt_0_15/GEN-SIM-RAW-RECO/IDEAL_V9_JobRobot/0000/D6A7AD6D-3FA2-DD11-A643-00163E1124D0.root 4 000200000000000001CBCC90 se07_cms /pnfs/lcg.cscs.ch/cms/trivcat/store/mc/JobRobot/QCD_pt_0_15/GEN-SIM-RAW-RECO/IDEAL_V9_JobRobot/0000/720A964F-EAA1-DD11-9547-001560AC7E98.root 4 000200000000000001CBC9B0 se11_cms /pnfs/lcg.cscs.ch/cms/trivcat/store/mc/JobRobot/QCD_pt_0_15/GEN-SIM-RAW-RECO/IDEAL_V9_JobRobot/0000/F43D2164-E5A1-DD11-A833-001560ADE172.root 4 000200000000000001CBC558 se07_cms /pnfs/lcg.cscs.ch/cms/trivcat/store/mc/JobRobot/QCD_pt_0_15/GEN-SIM-RAW-RECO/IDEAL_V9_JobRobot/0000/7A84964F-EAA1-DD11-A1D6-001560AC4F10.root 4 000200000000000001CBC3B8 se07_cms /pnfs/lcg.cscs.ch/cms/trivcat/store/mc/JobRobot/QCD_pt_0_15/GEN-SIM-RAW-RECO/IDEAL_V9_JobRobot/0000/D2FFB6F1-E5A1-DD11-9126-001560AD4140.root 4 000200000000000001CBBF20 se07_cms /pnfs/lcg.cscs.ch/cms/trivcat/store/mc/JobRobot/QCD_pt_0_15/GEN-SIM-RAW-RECO/IDEAL_V9_JobRobot/0000/C663BE0A-E1A1-DD11-8497-001560AD3140.root 4 000200000000000001CBBDD0 se04_cms /pnfs/lcg.cscs.ch/cms/trivcat/store/mc/JobRobot/QCD_pt_0_15/GEN-SIM-RAW-RECO/IDEAL_V9_JobRobot/0000/F409AC0C-E1A1-DD11-AAC6-001560AD12EE.root 4 000200000000000001CBBD58 se11_cms /pnfs/lcg.cscs.ch/cms/trivcat/store/mc/JobRobot/QCD_pt_0_15/GEN-SIM-RAW-RECO/IDEAL_V9_JobRobot/0000/22169023-E3A1-DD11-A9C3-001560AC4F10.root 3 000200000000000001CBC708 se06_cms /pnfs/lcg.cscs.ch/cms/trivcat/store/mc/JobRobot/QCD_pt_0_15/GEN-SIM-RAW-RECO/IDEAL_V9_JobRobot/0000/5233F663-E5A1-DD11-B912-0015600E3ECA.root 3 000200000000000001CBC660 se03_cms /pnfs/lcg.cscs.ch/cms/trivcat/store/mc/JobRobot/QCD_pt_0_15/GEN-SIM-RAW-RECO/IDEAL_V9_JobRobot/0000/D816593E-E4A1-DD11-90FB-001560AC2FD8.root 3 000200000000000001CBC330 se01_cms /pnfs/lcg.cscs.ch/cms/trivcat/store/mc/JobRobot/QCD_pt_0_15/GEN-SIM-RAW-RECO/IDEAL_V9_JobRobot/0000/E8F96658-E7A1-DD11-8A15-001560AC7E98.root 3 000200000000000001CBC060 se06_cms /pnfs/lcg.cscs.ch/cms/trivcat/store/mc/JobRobot/QCD_pt_0_15/GEN-SIM-RAW-RECO/IDEAL_V9_JobRobot/0000/2C8BA672-3FA2-DD11-AD24-001560AC7E98.root 3 000200000000000001CBBFC8 se11_cms /pnfs/lcg.cscs.ch/cms/trivcat/store/mc/JobRobot/QCD_pt_0_15/GEN-SIM-RAW-RECO/IDEAL_V9_JobRobot/0000/AC6BC55A-E7A1-DD11-95FD-001560AC2FD8.root 3 000200000000000001CBBE28 se06_cms /pnfs/lcg.cscs.ch/cms/trivcat/store/mc/JobRobot/QCD_pt_0_15/GEN-SIM-RAW-RECO/IDEAL_V9_JobRobot/0000/5C8659F3-E5A1-DD11-910B-001560AC2FD8.root 3 000200000000000001CBBBB8 se06_cms /pnfs/lcg.cscs.ch/cms/trivcat/store/mc/JobRobot/QCD_pt_0_15/GEN-SIM-RAW-RECO/IDEAL_V9_JobRobot/0000/E054F6FD-EBA1-DD11-9744-001560ADE172.root 2 000300000000000003811F50 se07_atlas /pnfs/lcg.cscs.ch/atlas/atlasmcdisk/mc08/AOD/mc08.105200.T1_McAtNlo_Jimmy.merge.AOD.e357_s462_r635_t53_tid064818/AOD.064818._00085.pool.root.2 2 000200000000000001CBCBF8 se08_cms /pnfs/lcg.cscs.ch/cms/trivcat/store/mc/JobRobot/QCD_pt_0_15/GEN-SIM-RAW-RECO/IDEAL_V9_JobRobot/0000/2C50E9A3-DEA1-DD11-A5E2-00163E1124E5.root 2 000200000000000001CBC8B0 se03_cms /pnfs/lcg.cscs.ch/cms/trivcat/store/mc/JobRobot/QCD_pt_0_15/GEN-SIM-RAW-RECO/IDEAL_V9_JobRobot/0000/CCE4DD2D-E0A1-DD11-9BAB-00163E1124D8.root 2 000200000000000001CBC6E0 se02_cms /pnfs/lcg.cscs.ch/cms/trivcat/store/mc/JobRobot/QCD_pt_0_15/GEN-SIM-RAW-RECO/IDEAL_V9_JobRobot/0000/6C8ABB58-E7A1-DD11-8181-001560AD4140.root 2 000200000000000001CBC6D0 se02_cms /pnfs/lcg.cscs.ch/cms/trivcat/store/mc/JobRobot/QCD_pt_0_15/GEN-SIM-RAW-RECO/IDEAL_V9_JobRobot/0000/E4FD8E50-EAA1-DD11-A3F7-001560AC2FD8.root 2 000200000000000001CBC6B8 se08_cms /pnfs/lcg.cscs.ch/cms/trivcat/store/mc/JobRobot/QCD_pt_0_15/GEN-SIM-RAW-RECO/IDEAL_V9_JobRobot/0000/50DF7BE4-E9A1-DD11-9DAD-001560AD42E0.root 2 000200000000000001CBC638 se01_cms /pnfs/lcg.cscs.ch/cms/trivcat/store/mc/JobRobot/QCD_pt_0_15/GEN-SIM-RAW-RECO/IDEAL_V9_JobRobot/0000/10DA201D-E3A1-DD11-8741-00163E1124EA.root 2 000200000000000001CBC498 se02_cms /pnfs/lcg.cscs.ch/cms/trivcat/store/mc/JobRobot/QCD_pt_0_15/GEN-SIM-RAW-RECO/IDEAL_V9_JobRobot/0000/681BBDBD-3EA2-DD11-B79B-001560AD22EA.root 2 000200000000000001CBC410 se03_cms /pnfs/lcg.cscs.ch/cms/trivcat/store/mc/JobRobot/QCD_pt_0_15/GEN-SIM-RAW-RECO/IDEAL_V9_JobRobot/0000/EC337DA3-DEA1-DD11-8EFC-00163E1124CF.root 2 000200000000000001CBC008 se02_cms /pnfs/lcg.cscs.ch/cms/trivcat/store/mc/JobRobot/QCD_pt_0_15/GEN-SIM-RAW-RECO/IDEAL_V9_JobRobot/0000/6E051A75-3FA2-DD11-9C45-001560AC4F10.root 2 000200000000000001CBBEC8 se01_cms /pnfs/lcg.cscs.ch/cms/trivcat/store/mc/JobRobot/QCD_pt_0_15/GEN-SIM-RAW-RECO/IDEAL_V9_JobRobot/0000/441FCF0B-E1A1-DD11-A6C8-001560AD42E0.root 2 000200000000000001CBBD00 se05_cms /pnfs/lcg.cscs.ch/cms/trivcat/store/mc/JobRobot/QCD_pt_0_15/GEN-SIM-RAW-RECO/IDEAL_V9_JobRobot/0000/DCD8281D-E3A1-DD11-BD74-00163E1124E5.root 2 000200000000000001CBBB08 se08_cms /pnfs/lcg.cscs.ch/cms/trivcat/store/mc/JobRobot/QCD_pt_0_15/GEN-SIM-RAW-RECO/IDEAL_V9_JobRobot/0000/CA08F32D-E0A1-DD11-AC04-00163E1124EA.root 1 000300000000000003811860 se05_atlas /pnfs/lcg.cscs.ch/atlas/atlasmcdisk/mc08/AOD/mc08.105200.T1_McAtNlo_Jimmy.merge.AOD.e357_s462_r635_t53_tid064824/AOD.064824._00223.pool.root.1 1 00030000000000000380F5D0 se12_atlas /pnfs/lcg.cscs.ch/atlas/atlasmcdisk/mc08/AOD/mc08.105200.T1_McAtNlo_Jimmy.merge.AOD.e357_s462_r635_t53_tid064820/AOD.064820._00120.pool.root.2 1 0003000000000000037FA190 se09_atlas /pnfs/lcg.cscs.ch/atlas/atlasmcdisk/mc08/AOD/mc08.105200.T1_McAtNlo_Jimmy.merge.AOD.e357_s462_r635_t53_tid064822/AOD.064822._00176.pool.root.1 1 000200000000000001CBC018 se08_cms /pnfs/lcg.cscs.ch/cms/trivcat/store/mc/JobRobot/QCD_pt_0_15/GEN-SIM-RAW-RECO/IDEAL_V9_JobRobot/0000/483B0D24-E3A1-DD11-9A85-001560AC2FD8.root 1 000200000000000001CBBFB0 se09_cms /pnfs/lcg.cscs.ch/cms/trivcat/store/mc/JobRobot/QCD_pt_0_15/GEN-SIM-RAW-RECO/IDEAL_V9_JobRobot/0000/18699A64-E5A1-DD11-BB6F-001560AC4F10.root 1 000200000000000001CBBE78 se08_cms /pnfs/lcg.cscs.ch/cms/trivcat/store/mc/JobRobot/QCD_pt_0_15/GEN-SIM-RAW-RECO/IDEAL_V9_JobRobot/0000/627E23C9-3DA2-DD11-A4E5-001560AC1D24.root </pre> %ENDTWISTY% I replicated both datasets. An example for how to do it using the present version of my dcache shellutils: <pre> find /pnfs/lcg.cscs.ch/cms/trivcat/store/mc/SAM/QCD_pt_0_15/GEN-SIM-RAW-RECO/IDEAL_V9_SAM/0000 -type f > dataset-SAM-pnfs.lst dc_get_ID_from_pnfsnamelist.sh dataset-SAM-pnfs.lst | dc_get_cacheinfo_from_IDlist.sh | dc_replicate_IDlist.sh -p "se10_cms se11_cms se12_cms se13_cms se14_cms se15_cms se16_cms se17_cms" -f -d -r 2 </pre> ---+++ Old graphs and information Running and queued jobs <br><img src="%ATTACHURLPATH%/running-20090613-0955-week.gif" alt="running-20090613-0955-week.gif" width='481' height='179' /> <img src="%ATTACHURLPATH%/queue-20090613-0955-week.gif" alt="queue-20090613-0955-week.gif" width='481' height='179' /> <br><img src="%ATTACHURLPATH%/workers-cpu-report-20090613-1010-week.gif" alt="workers-cpu-report-20090613-1010-week.gif" width='397' height='168' /> dcap and gsiftp movers <br><img src="%ATTACHURLPATH%/movers_default-20090613-0955-week.gif" alt="movers_default-20090613-0955-week.gif" width='481' height='179' /> <img src="%ATTACHURLPATH%/movers_wan-20090613-0955-week.gif" alt="movers_wan-20090613-0955-week.gif" width='481' height='179' /> -- Main.DerekFeichtinger - 25 May 2009 ---------------- %ICON{arrowleft}% Go to [[CMSSiteLogXX][previous page]] / [[CMSSiteLogXX][next page]] of CMS site log %M%
Attachments
Attachments
Topic attachments
I
Attachment
History
Action
Size
Date
Who
Comment
jpg
transfers-step09-06-11.jpg
r1
manage
41.7 K
2009-06-11 - 07:31
DerekFeichtinger
jpg
transfers-t1t2-step09-belforte.jpg
r1
manage
36.0 K
2009-06-23 - 12:19
DerekFeichtinger
gif
movers_default-20090613-0955-week.gif
r1
manage
20.6 K
2009-06-13 - 08:01
DerekFeichtinger
gif
movers_wan-20090613-0955-week.gif
r1
manage
18.8 K
2009-06-13 - 08:00
DerekFeichtinger
gif
running-20090613-0955-week.gif
r1
manage
18.8 K
2009-06-13 - 07:59
DerekFeichtinger
gif
queue-20090613-0955-week.gif
r1
manage
17.2 K
2009-06-13 - 07:59
DerekFeichtinger
gif
workers-cpu-report-20090623-1140-month.gif
r1
manage
16.7 K
2009-06-23 - 10:42
DerekFeichtinger
gif
workers-cpu-report-20090613-1010-week.gif
r1
manage
15.0 K
2009-06-13 - 08:12
DerekFeichtinger
gif
movers_wan-20090623-1140-month.gif
r1
manage
13.3 K
2009-06-23 - 10:44
DerekFeichtinger
gif
running-month-step09may.gif
r2
r1
manage
12.9 K
2009-06-03 - 13:17
DerekFeichtinger
running jobs
gif
movers_default-20090623-1140-month.gif
r1
manage
12.8 K
2009-06-23 - 10:43
DerekFeichtinger
gif
running-20090623-1140-month.gif
r1
manage
12.8 K
2009-06-23 - 10:40
DerekFeichtinger
gif
queue-20090623-1140-month.gif
r1
manage
12.3 K
2009-06-23 - 10:41
DerekFeichtinger
gif
queued_movers_default-20090623-1140-month.gif
r1
manage
12.0 K
2009-06-23 - 10:45
DerekFeichtinger
gif
queued_movers_wan-20090623-1140-month.gif
r1
manage
12.0 K
2009-06-23 - 10:46
DerekFeichtinger
gif
queue-month-step09may.gif
r2
r1
manage
11.5 K
2009-06-03 - 13:17
DerekFeichtinger
queued jobs
jpg
storage_free_cms_20090611.jpg
r1
manage
9.9 K
2009-06-11 - 08:08
DerekFeichtinger
E
dit
|
A
ttach
|
Watch
|
P
rint version
|
H
istory
: r24
<
r23
<
r22
<
r21
<
r20
|
B
acklinks
|
V
iew topic
|
Ra
w
edit
|
M
ore topic actions
Topic revision: r24 - 2009-09-17
-
DerekFeichtinger
LCGTier2
Log In
(Topic)
LCGTier2 Web
Create New Topic
Index
Search
Changes
Notifications
Statistics
Preferences
Users
Entry point / Contact
RoadMap
ATLAS Pages
CMS Pages
CMS User Howto
CHIPP CB
Outreach
Technical
Cluster details
Services
Hardware and OS
Tools & Tips
Monitoring
Logs
Maintenances
Meetings
Tests
Issues
Blog
Home
Site map
CmsTier3 web
LCGTier2 web
PhaseC web
Main web
Sandbox web
TWiki web
LCGTier2 Web
Users
Groups
Index
Search
Changes
Notifications
RSS Feed
Statistics
Preferences
P
P
View
Raw View
Print version
Find backlinks
History
More topic actions
Edit
Raw edit
Attach file or image
Edit topic preference settings
Set new parent
More topic actions
Warning: Can't find topic "".""
Account
Log In
E
dit
A
ttach
Copyright © 2008-2024 by the contributing authors. All material on this collaboration platform is the property of the contributing authors.
Ideas, requests, problems regarding TWiki?
Send feedback


