24. 07. 2009 Repetition of Hammercloud exercise
Original letter roughly describing the exercise from Guenter Duckeck (LMU Muenchen) from July 16, 2009: Show
Show  Hide
Hide Dear all, we would suggest to run next week another Hammercloud DA stress test on all sites of the GridKa cloud . In Step09 we had rather mixed results, some sites performed excellent and others suffered big problems, it's important to see whether the former can sustain and the latter improve ... We'd propose to proceed as follows: - start Monday 20.7. and run continuously for about 6-8 days - we try to load sites with jobs, with a max of ~500 jobs simultaneously per site. -- it is up to the site to further reduce this by their batch system limits according to its preferences - we would exercise the 3 access modes currently used by ATLAS (lcg- cp to WN via panda, lcg-cp to WN in parallel to athena running via filestager and direct dcap/rfio access via athena/root). However, not in parallel as in Step09, but rather sequentially, i.e. each mode would be executed for ~2 days. We discuss the results in the Wuppertal F2F meeting 30/31 July. If sites have problems to participate please let us know. We could move it by a few days but it should be finished in time before the Wuppertal meeting.
Recapitulation of the problems observed in STEP09
Many ATLAS jobs ended up running with bad efficiency and impacted the cluster heavily, because they followed a usage pattern for which the hardware is not laid out, and which will become even worse with trends in the developing CPU technologies. The problem derives from the tendency of many jobs to stage in huge amount of files from the close SE to the local file system of the worker node, before the actual computation. The technical trend in CPUs goes in the direction of more and more cores being available per compute node (e.g. 16 cores per node in the CSCS cluster of 2009), while the amount of local disks remains the same in the typical high density blade nodes (e.g. two local disks per blade in our cluster). So, this leads to a worst case scenario of 16 high efficiency transfer streams going to the two local disks. Our current network connection to every blade is 1Gb/s, and even though this could be increased, one cannot add more internal disks. So the jobs end up severely competing for that resource, and the CPU efficiency decreases dramatically due to CPU being most of the time in CPU_wait_I/O. Moreover, we noted a growing amount of failing local disks, even though they are good quality SAS devices. All of the current SE technologies offer POSIX-like direct access to the storage (dcap, rfio, ...) , so jobs can directly read with pretty good efficiency from the storage (and the read rate of the typical analysis jobs is much lower than the rate of a high efficieny sequential transfer. Over the years, most LCG guidelines specified ~1-2 MB/s per core. We had calculated double of that for our cluster). Our cluster was laid out for this kind of usage. CMS is using dcap all the time and we never observed any significant CPU_wait_I/O, even with the cluster being completely filled with CMS jobs. Please note: Using the dccp command to stage in files at the beginning of the job is the worst possibility.dccp uses the dcap protocol to copy a whole file, not to be confused with using dcap from within the analysis job via an open filehandle and reading the file in chunks. Now, most dcache sites are configured to allow only a small number of SRM/gsiftp transfers per file server, because having too many high efficiency transfers on the same disks is not optimal. It is better to queue them. But dcache sites allow a a high number of dcap transfers per file pool (~server), because this is associated with the access pattern of analysis jobs reading at moderate speed. E.g. at CSCS we allow 100 active dcap movers (transfers) per file pool, so if you use dccp from a large number of jobs, that's how many high efficiency sequential transfers may end up on a single file server.
- Comment by RiccardoMurri: Actually, the high load we observed on the WN seems to stem from a combination of: CPU-intensive jobs + large disk writes + random disk reads. We were able to ~reproduce the effect with the attached highload.sh
 script. The command
 ./highload.sh Nshould produce a load of 3*N, but already with./highload.sh 6we observe a load of 24 (on a 16-core WN) and./highload.sh 8raises the load to ~36.
2009-07-24 Observations on current Hammercloud ATLAS jobs
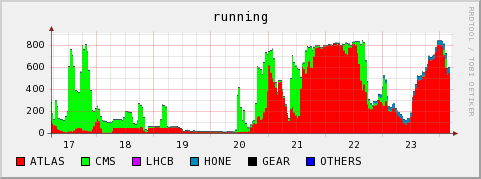
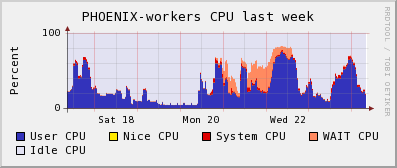
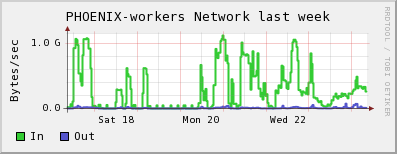
The following plots are from our local monitoring. They show that on 2009-07-21/22 the cluster was filled with ATLAS jobs which did not use dcap direct access to the SE, and they end up with very bad CPU efficiency. On 2009-07-23 we see a peak of jobs with a much more successful access pattern. The cluster is again filled with ATLAS jobs, they are using dcap, and they run without the WN CPUs spending time in CPU_wait_I/O. However the network throughput of the WNs seems somehow a bit small when compared to other jobs using direct dcap through ROOT on our cluster. It is difficult to get exact numbers from the plots, but the right corner of the running jobs, dcap movers and network throughput plots would indicate that- ~800 jobs were running (Our system has 960 cores in total, so 80% on the total system's CPU graph would indicate ~100% efficiency for every job)
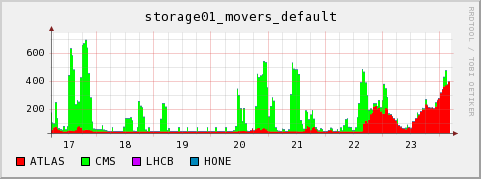
- only ~400 dcap movers were open. Rodney Walker provided information as to 400 jobs having run production at that time (which naturally do no read access on the SE), so this is consistent.
- the ~400 analysis jobs were reading at a total of ~ 375 MB/s. So this would indicate < 1 MB/s per dcap mover. Since no CPU_wait can be observed and the CPU curve matches the No. of jobs that ran at that time very closely, neither network nor other I/O was an issue, and the efficiencies of the jobs were CPU limited.
 CPU efficiency:
 active dcap movers:
 active gsiftp movers:
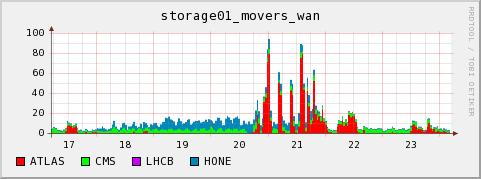 worker node network usage
external monitoring by ATLAS operations
The ganga robot main page: http://gangarobot.cern.ch/hc/all/test/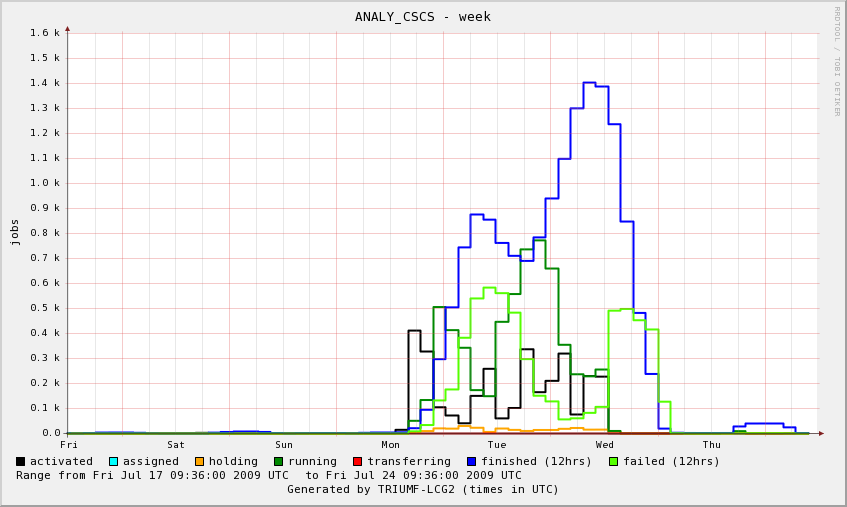
comparison with CMS dcap direct access analysis jobs
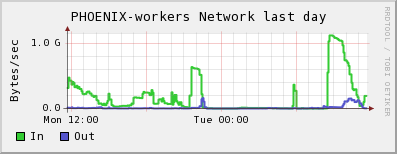
Here some example monitoring data of the cluster being full of CMS analysis jobs, the number of active (direct) dcap accesses and the network throughput by the worker nodes. One can see that higher I/O rates for in-job reading via dcap are possible. But it is also true that the network access or the dcache performance may become a bottleneck. However, we have not observed serious issues in that regard on our cluster. active dcap movers: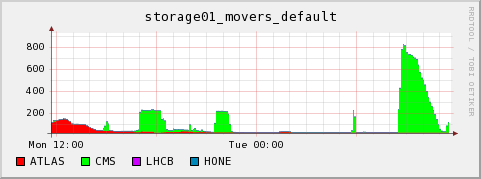 worker node network usage
 We have more high water marks with jobs doing massive I/O via dcap (>30MB/s per job), e.g. as documented last year on the CMS site log

| I | Attachment | History | Action | Size | Date | Who | Comment |
|---|---|---|---|---|---|---|---|
| |
ANALY_CSCS-week-20090742.png | r1 | manage | 58.9 K | 2009-07-24 - 11:44 | DerekFeichtinger | job graph generated by Triumf |
| |
highload.sh | r1 | manage | 0.6 K | 2009-07-24 - 09:18 | RiccardoMurri | Shell script to reproduce the high load observed w/ ATLAS hammercloud jobs |
| |
movers_default-20090623-1140-day.gif | r1 | manage | 14.3 K | 2009-07-24 - 09:08 | DerekFeichtinger | |
| |
movers_default-20090724-0830-week.gif | r1 | manage | 17.7 K | 2009-07-24 - 07:34 | DerekFeichtinger | |
| |
movers_wan-20090724-0830-week.gif | r1 | manage | 18.1 K | 2009-07-24 - 07:37 | DerekFeichtinger | |
| |
running-20090724-0830-week.gif | r1 | manage | 19.3 K | 2009-07-24 - 07:33 | DerekFeichtinger | |
| |
worker-nw-report-20090623-1140-day.gif | r1 | manage | 15.6 K | 2009-07-24 - 09:09 | DerekFeichtinger | |
| |
worker-nw-report-20090724-0830-week.gif | r1 | manage | 18.1 K | 2009-07-24 - 09:06 | DerekFeichtinger | |
| |
workers-cpu-report-20090724-0830-week.gif | r1 | manage | 15.1 K | 2009-07-24 - 07:33 | DerekFeichtinger |
Topic revision: r7 - 2009-07-24 - DerekFeichtinger

Ideas, requests, problems regarding TWiki? Send feedback