<!-- keep this as a security measure:
* Set ALLOWTOPICCHANGE = TWikiAdminGroup,Main.LCGAdminGroup, LHConCRAYGroup
* Set ALLOWTOPICRENAME = TWikiAdminGroup,Main.LCGAdminGroup, LHConCRAYGroup
#uncomment this if you want the page only be viewable by the internal people
* Set ALLOWTOPICVIEW = TWikiAdminGroup,Main.LCGAdminGroup, LHConCRAYGroup
-->
* Site Availability (measured with HC Functional Tests for auto-exclusion)
PROD: Phoenix 98% - Piz Daint 98%
ANALY:Phoenix 98% - Pix Daint 98%
* Site Availability (measured with HC Functional Tests for auto-exclusion)
PROD: Phoenix % - Piz Daint %
ANALY:Phoenix % - Pix Daint % * Comments:CPU/WC efficiency quite poor up to 19 Oct, then it recovered
* Comments:
* Set ALLOWTOPICCHANGE = TWikiAdminGroup,Main.LCGAdminGroup, LHConCRAYGroup
* Set ALLOWTOPICRENAME = TWikiAdminGroup,Main.LCGAdminGroup, LHConCRAYGroup
#uncomment this if you want the page only be viewable by the internal people
* Set ALLOWTOPICVIEW = TWikiAdminGroup,Main.LCGAdminGroup, LHConCRAYGroup
-->
- Acceptance tests for Piz Daint as production resource during 2017
- Run 1. 2017-05-05 to 2017-05-26 (22 days)
- Run 2. 2017-05-27 to 2017-06-25 (both inclusive, 30 days)
- Run 3. 2017-06-26 to 2017-07-19 (both inclusive, 23 days)
- Run 4. 2017-07-25 to 2017-08-02 (both inclusive, 9 days)
- Run 5. 2017-08-03 to 2017-08-31 (both inclusive, 28 days)
- Run 6. 2017-09-01 to 2017-10-01 (both inclusive, 31 days)
- Run 7. 2017-10-10 to 2017-11-05 (both inclusive, 26 days). LAST RUN.
Acceptance tests for Piz Daint as production resource during 2017
Track record for the different production runs for running the CSCS Tier2 compute resources on CRAY.Run 1. 2017-05-05 to 2017-05-26 (22 days)
Agreed metrics (per VO) for both Phoenix and CRAY:- Produced walltime (good & bad) per core, per type of job
- Walltime of good vs failed jobs, per type of job
- CPU/Wallclock efficiency for successful jobs, per type of job
- Site Availability
- Alternative site HepSpec value, if wanted
- Any other metric you think important, for discussion
- Produced walltime per core per VO
- Fair share distribution
ATLAS
- Site Availability: Phoenix 56.53 - Piz Daint 58.21 (measured with HammerCloud exclusion functional tests [https://tinyurl.com/ybyp6z5t])
- Comments: Availability figures: Production queues only (no analy). Availability affected by long dCache related downtime. Analy queue on Piz Daint has been kept offline still.
CMS
- Site Availability: X%
- Comments
| jobtype | good_cpu_h | all_cpu_h | good_wallt_h | all_wallt_h | good_wallt_% | good_cpu_eff_% |
|---|---|---|---|---|---|---|
| analysistest | 0.0 | 0.3 | 0.0 | 1.9 | 0.0 | 0.0 |
| hctest | 4221.3 | 4233.0 | 5013.2 | 7213.2 | 69.5 | 99.7 |
| production | 267.1 | 267.1 | 283.1 | 390.4 | 72.5 | 100.0 |
| reprocessing | 1756.9 | 1756.9 | 2051.8 | 2051.9 | 100.0 | 100.0 |
| hcxrootd | 942.0 | 944.7 | 1480.2 | 1571.9 | 94.2 | 99.7 |
| psst | 0.0 | 0.0 | 0.0 | 0.0 | ||
| analysis | 105662.1 | 133938.9 | 165278.4 | 326166.2 | 50.7 | 78.9 |
| unknown | 0.0 | 0.0 | 0.0 | 0.0 | ||
| ALL_JOBS | 112849.4 | 141140.9 | 174106.7 | 337395.5 | 51.6 | 80.0 |
LHCb
- Site Availability: Phoenix: 55%, Piz Daint: 88%
- Site Reliability: Phoenix: 73%, Piz Daint: 100%
- Site HS06 delivered: Phoenix: 556 kHS06-days, Piz Daint: 231 kHS06-days -- measured by LHCb (in job)
Site HS06 delivered: Phoenix: 420 kHS06-days, Piz Daint: 159 kHS06-days -- measured by CSCS
- The storage is attached to Phoenix, therefore a storage outage affects only the numbers of Phoenix not Piz Daint.
- Site Availability/Reliability are measured with SAM jobs.
- Piz Daint user jobs: Of the 90% failed jobs, 10% got killed, 80% stalled (most likely pilot got killed).
CSCS
- Site Availability: X%
- Capacity Phoenix 3125760 core-hours (5920*24*22), used at 88%
- Capacity Piz Daint 844800 core-hours (25*64*24*22), used at 42%
- Published HS06 value: 11.19 HS06/core on Phoenix, 12.96 HS06/core on CRAY (830/64, needs to be re-calculated)
- 1-week downtime due to problems with dcache
Minutes / action items
- Attendants - CSCS: Pablo, Stefano, Miguel, Dino - CHIPP: Christoph, Gianfranco, Thomas, Nina, Derek, Roland
- Pablo asks whether we would like him to continue organize the meetings - Yes
- Christoph - in resource rev board there was discussion on how to measure - one should not only look at the total - should also look at the /event throughput/. - we need to identify how the Experiments measure the events
- Pablo asks in regard to the suitability of the metrics - GF says that the current dashboard is not able to yield all the needed information (I am unsure, but I guess it was in regard to the job types)
- GF for ATLAS - notices that there may not have been enough statistics due to some downtime - analysis of errors - thinks that many job failures due to dcache problems but was not yet able to delve deeper - Pablo notes about difference in walltime between what they measure locally and what is showed by dashboard. For LHCb it is almost exact - GF says that analysis jobs were not included in his numbers and if these were added would come close.
- Derek for CMS - I apologize for the fact that we noticed too late that there is a problem with the job submission to the Piz Daint system. CMS still is sending jobs to arcbrisi. But the acitive ARC CE is arc04.lcg.cscs.ch. - We will resolve this problem by contacting CMS operations - We will concentrate on the measurement
- Roland for LHCb- Discussion on the high user job failure rate - Roland thinks it may have to do with the pilot job being killed, since the jobs show up as "stalled" which often is a sign of that failure mode.
- CSCS on the local metrics - GF how does the TOTAL relate to the total theoretical wallclock hours that were available on the system? - Pablo tries to explain the usage distribution on Phoenix. LHCb seemingly not so hit by storage downtime. - 1-week downtime due to problems with dcache - Pablo asks all the experiments to investigate failures on the HPC system so as to identify issues in this period
- Action items 1. CMS - [ ] CMS will provide the numbers for Phoenix after the meeting, though we cannot provide the numbers for Piz Daint. - [ ] CMS needs to get jobs routed via arc04.lcg.cscs.ch and no longer via arcbrisi. - [ ] CMS will try to prepare a page where we share the links for the monitoring plots and how we derive the numbers. 2. We will repeat the exercise for three weeks - Measurement period should start as soon as CMS is online - We experiments should try to share the numbers during the period. 3. Pablo will convene another meeting in approx. 1 month of time 4. All VOs need to add the event throughput data to the tables in the already finished and subsequent runs
Run 2. 2017-05-27 to 2017-06-25 (both inclusive, 30 days)
Agreed metrics as in Run 1.ATLAS
- Site Availability (measured with HC Functional Tests for auto-exclusion)
PROD: Phoenix 96.86 - Piz Daint 96.93
ANALY:Phoenix 97.49 - Pix Daint 68.29 - Comments: Piz Daint downtimes not recorded (HC cannot blacklist if no jobs run)
CMS
- Site Availability: X%
- Comments
| jobtype | good_cpu_h | all_cpu_h | good_wallt_h | all_wallt_h | good_wallt_% | good_cpu_eff_% |
|---|---|---|---|---|---|---|
| analysistest | 45.3 | 68.2 | 74.4 | 109.1 | 68.2 | 66.4 |
| hctest | 4709.4 | 4711.1 | 5003.3 | 5649.4 | 88.6 | 100.0 |
| production | 5777.8 | 5823.2 | 6213.2 | 6329.6 | 98.2 | 99.2 |
| reprocessing | 69881.8 | 69886.3 | 79344.2 | 80329.7 | 98.8 | 100.0 |
| hcxrootd | 1060.3 | 1062.2 | 1486.7 | 1691.5 | 87.9 | 99.8 |
| psst | 0.0 | 0.0 | 0.0 | 0.0 | ||
| analysis | 137818.8 | 173808.5 | 230806.3 | 449626.3 | 51.3 | 79.3 |
| unknown | 0.0 | 0.0 | 0.0 | 0.0 | ||
| ALL_JOBS | 219293.4 | 255359.5 | 322928.1 | 543735.6 | 59.4 | 85.9 |
LHCb
- Site Availability: Phoenix: 97%, Piz Daint: 89%
- Site Reliability: Phoenix: 98%, Piz Daint: 100%
- Site HS06 delivered: Phoenix: 585 kHS06-days, Piz Daint: 150 kHS06-days -- measured by LHCb (in job)
Site HS06 delivered: Phoenix: 439 kHS06-days, Piz Daint: 127 kHS06-days -- measured by CSCS
- The storage is attached to Phoenix, therefore a storage outage affects only the numbers of Phoenix not Piz Daint.
- Site Availability/Reliability are measured with SAM jobs.
- Piz Daint simulation jobs: Of the 15% failed jobs, 50% stalled, 50% had an application error.
- Piz Daint user jobs: Of the 15% failed jobs, 0% got killed, 100% stalled (most likely pilot got killed).
CSCS
- Site Availability: X%
- Capacity Phoenix 4262400 core-hours (5920*24*30), used at 88%
- Capacity Piz Daint 1152000 core-hours (25*64*24*30), used at 64%
- Published HS06 value: 11.19 HS06/core on Phoenix, 12.96 HS06/core on CRAY (830/64, needs to be re-calculated)
Run 3. 2017-06-26 to 2017-07-19 (both inclusive, 23 days)
Agreed metrics as in Run 1. NOTE: Canceled due to serious instability of the system.ATLAS
- Site Availability (measured with HC Functional Tests for auto-exclusion)
PROD: Phoenix 100 - Piz Daint 97.66
ANALY:Phoenix 100 - Pix Daint 89.6 - Comments: too many instabilities
CMS
| jobtype | good_cpu_h | all_cpu_h | good_wallt_h | all_wallt_h | good_wallt_% | good_cpu_eff_% |
|---|---|---|---|---|---|---|
| analysistest | 40.0 | 52.3 | 123.0 | 412.4 | 29.8 | 76.5 |
| hctest | 5446.8 | 5449.3 | 5934.5 | 5984.3 | 99.2 | 100.0 |
| production | 9683.2 | 25484.3 | 53574.9 | 90813.2 | 59.0 | 38.0 |
| reprocessing | 0.0 | 0.0 | 1.6 | 1.6 | 100.0 | |
| hcxrootd | 1046.5 | 1048.1 | 1569.2 | 1615.6 | 97.1 | 99.8 |
| analysis | 206448.3 | 273650.6 | 357210.2 | 645075.6 | 55.4 | 75.4 |
| unknown | 0.0 | 0.0 | 0.0 | 0.0 | ||
| ALL_JOBS | 222664.8 | 305684.6 | 418413.4 | 743902.7 | 56.2 | 72.8 |
LHCb
- Site Availability: Phoenix: 97%, Piz Daint: 97%
- Site Reliability: Phoenix: 100%, Piz Daint: 100%
- Site State Unknown: Phoenix: 5%, Piz Daint: 59%
- Site HS06 delivered: Phoenix: 538 kHS06-days, Piz Daint: 170 kHS06-days -- measured by LHCb (in job)
Site HS06 delivered: Phoenix: ??? kHS06-days, Piz Daint: ??? kHS06-days -- measured by CSCS
- The storage is attached to Phoenix, therefore a storage outage affects only the numbers of Phoenix not Piz Daint.
- Site Availability/Reliability are measured with SAM jobs.
- Piz Daint simulation jobs: Of the 18% failed jobs, 79% stalled, 5% had an application error.
- Piz Daint user jobs: Of the 19% failed jobs, 16% got killed, 75% stalled (most likely pilot got killed), 9% had an application error..
CSCS
- Site Availability: X%
- Capacity Phoenix 3267840 core-hours (5920*24*23), used at 97%
- Capacity Piz Daint 883200 core-hours (25*64*24*23), used at 84%
- Published HS06 value: 11.19 HS06/core on Phoenix, 12.96 HS06/core on CRAY (830/64, needs to be re-calculated)
Run 4. 2017-07-25 to 2017-08-02 (both inclusive, 9 days)
Agreed metrics as in Run 1.ATLAS
- Site Availability (measured with HC Functional Tests for auto-exclusion)
PROD: Phoenix 100 - Piz Daint 100
ANALY:Phoenix 100 - Pix Daint 99.74 - Comments: Same efficiency trend as recorded in the previous runs
CMS
- Comments by Derek
- Tables generated by automatic scripts
- After a long toil and hunting for responsible contacts within CMS we are getting results! Needed Thomas, Miguel and me in an effort that was much too big. But hopefully we are now reestablishing the contacts and knowledge that was lost in the changes beginning of this year.
- The successful running of CMS production jobs is still very fresh, so I only put in the results for the short period since Sep 21st. But the outlook is good.
| jobtype | good_cpu_h | all_cpu_h | good_wallt_h | all_wallt_h | good_wallt_% | good_cpu_eff_% |
|---|---|---|---|---|---|---|
| analysistest | 17.8 | 19.6 | 22.9 | 25.3 | 90.5 | 90.8 |
| hctest | 2719.8 | 2719.8 | 2951.1 | 2991.7 | 98.6 | 100.0 |
| production | 11957.9 | 11957.9 | 14411.8 | 14445.4 | 99.8 | 100.0 |
| hcxrootd | 320.2 | 321.1 | 485.7 | 506.8 | 95.8 | 99.7 |
| analysis | 122246.0 | 143367.4 | 153624.5 | 208432.8 | 73.7 | 85.3 |
| unknown | 0.0 | 0.0 | 0.0 | 0.0 | ||
| ALL_JOBS | 137261.7 | 158385.8 | 171496.0 | 226402.0 | 75.7 | 86.7 |
| jobtype | good_cpu_h | all_cpu_h | good_wallt_h | all_wallt_h | good_wallt_% | good_cpu_eff_% |
|---|---|---|---|---|---|---|
| production | 1058.5 | 1058.5 | 1304.3 | 1304.3 | 100.0 | 100.0 |
| ALL_JOBS | 1058.5 | 1058.5 | 1304.3 | 1304.3 | 100.0 | 100.0 |
LHCb
- Site Availability: Phoenix: 99%, Piz Daint: 100%
- Site Reliability: Phoenix: 100%, Piz Daint: 100%
- Site State Unknown: Phoenix: 0%, Piz Daint: 10%
- Site HS06 delivered: Phoenix: 231 kHS06-days, Piz Daint: 123 kHS06-days -- measured by LHCb (in job)
Site HS06 delivered: Phoenix: 146 kHS06-days, Piz Daint: 72 kHS06-days -- measured by CSCS
- The storage is attached to Phoenix, therefore a storage outage affects only the numbers of Phoenix not Piz Daint.
- Site Availability/Reliability are measured with SAM jobs.
- Piz Daint simulation jobs: Of the 9% failed jobs, 36% stalled, 7% had an application error.
- Piz Daint user jobs: Of the 23% failed jobs, 12% got killed, 2% stalled (most likely pilot got killed), 85% had an application error..
CSCS
- Capacity Phoenix 1'278'720 core-hours (5920*24*9)
- Capacity Piz Daint 345'600 core-hours (25*64*24*9)
- Published HS06 value: 11.19 HS06/core on Phoenix, 12.96 HS06/core on CRAY (830/64, needs to be re-calculated)
- LHConCRAY-Run4_CSCS.pdf: Run4 from a system perspective
Run 5. 2017-08-03 to 2017-08-31 (both inclusive, 28 days)
Agreed metrics as in Run 1.ATLAS
- Efficiencies in () are from Run 3 (23 days)
- Site Availability (measured with HC Functional Tests for auto-exclusion)
PROD: Phoenix 96.4% (100% Run 3) - Piz Daint 96.7% (100%)
ANALY:Phoenix 41% (100% Run 3) - Pix Daint 41% (99.74% Run 3) - Comments: gap in the efficiencies bridging up, but Phoenix efficiences dropped vs. Run
CMS
| jobtype | good_cpu_h | all_cpu_h | good_wallt_h | all_wallt_h | good_wallt_% | good_cpu_eff_% |
|---|---|---|---|---|---|---|
| analysistest | 0.0 | 13.1 | 0.0 | 197.1 | 0.0 | 0.0 |
| hctest | 6371.5 | 6375.6 | 7110.5 | 7447.6 | 95.5 | 99.9 |
| production | 11892.9 | 11927.9 | 254941.4 | 265243.8 | 96.1 | 99.7 |
| hcxrootd | 1500.7 | 1503.9 | 2630.0 | 2710.9 | 97.0 | 99.8 |
| psst | 0.0 | 0.0 | 0.0 | 0.0 | ||
| analysis | 196284.4 | 212641.1 | 289323.5 | 559109.0 | 51.7 | 92.3 |
| unknown | 0.0 | 0.0 | 0.0 | 0.0 | ||
| ALL_JOBS | 216049.5 | 232461.6 | 554005.4 | 834708.4 | 66.4 | 92.9 |
| jobtype | good_cpu_h | all_cpu_h | good_wallt_h | all_wallt_h | good_wallt_% | good_cpu_eff_% |
|---|---|---|---|---|---|---|
| hctest | 3716.9 | 3756.2 | 4816.0 | 4990.0 | 96.5 | 99.0 |
| production | 1096.9 | 1137.0 | 1570.5 | 2157.6 | 72.8 | 96.5 |
| hcxrootd | 47.2 | 47.2 | 109.3 | 111.3 | 98.2 | 100.0 |
| psst | 0.0 | 0.0 | 0.0 | 0.0 | ||
| analysis | 5647.9 | 7127.6 | 15577.5 | 34449.7 | 45.2 | 79.2 |
| ALL_JOBS | 10508.9 | 12068.0 | 22073.3 | 41708.6 | 52.9 | 87.1 |
LHCb
- Site Availability: Phoenix: 93%, Piz Daint: 47%
- Site Reliability: Phoenix: 94%, Piz Daint: 50%
- Site State Unknown: Phoenix: 19%, Piz Daint: 73%
- Site HS06 delivered: Phoenix: 372 kHS06-days, Piz Daint: 220 kHS06-days -- measured by LHCb (in job)
Site HS06 delivered: Phoenix: 295 kHS06-days, Piz Daint: 192 kHS06-days -- measured by CSCS
- The storage is attached to Phoenix, therefore a storage outage affects only the numbers of Phoenix not Piz Daint.
- Site Availability/Reliability are measured with SAM jobs.
- Piz Daint simulation jobs: Of the 9% failed jobs, 24% stalled, 74% had an application error.
- Piz Daint user jobs: Of the 6% failed jobs, 11% got killed, 3% stalled (most likely pilot got killed), 80% had an application error..
CSCS
- Configuration for reference:
- 64 GB of SWAP using DWS on 4 LHC DWS nodes
- 64 core/node allocatable by jobs
- Memory limits set to 6000MB/core, but memory is not a consumable resource, only cores.
- CVMFS tiered cache: upper layer 6GB in RAM, lower layer preloaded on GPFS
- Capacity Phoenix 3'978'240 core-hours (5920*24*28), utilized at 80%
- Capacity Piz Daint 1'075'200 core-hours (25*64*24*28), utilized at 85%
- Published HS06 value: 11.19 HS06/core on Phoenix, 12.96 HS06/core on CRAY (830/64, needs to be re-calculated)
- LHConCRAY-Run5_CSCS.pdf: Run5 from a system perspective
Other remarks/notes
- ATLAS and CMS report high failure rates in both Phoenix and CRAY
- There is a big mismatch (4-5x) between produced CMS wallclock in the portal and that reported by CSCS, which requires an investigation. CMS will contact CSCS if precise job accounting data is needed.
- There are reported big loads in the DVS in Daint, which are going to be addressed (or at least try to) by using DataWarp for Scratch
- Fairshare effectiveness in Piz Daint needs to be looked at, since LHCb should have half the produced hours than ATLAS (both VOs seemed to be fully productive during this Run)
Run 6. 2017-09-01 to 2017-10-01 (both inclusive, 31 days)
Agreed metrics as in Run 1.ATLAS
- Site Availability (measured with HC Functional Tests for auto-exclusion)
PROD: Phoenix 90.27 - Piz Daint % 87.97
ANALY:Phoenix 90.35 - Pix Daint % 87.74
- Site Availability and Reliability (measured with the SAM profile ATLAS_CRITICAL)
Availability CSCS-LCG2: 82.86
Reliability CSCS-LCG2: 91.82%
- Comments: GPFS instabilities caused more failures than usual
CMS
| jobtype | good_cpu_h | all_cpu_h | good_wallt_h | all_wallt_h | good_wallt_% | good_cpu_eff_% |
|---|---|---|---|---|---|---|
| analysistest | 57.1 | 57.9 | 68.7 | 75.9 | 90.5 | 98.6 |
| hctest | 5617.0 | 5655.1 | 6274.7 | 6877.5 | 91.2 | 99.3 |
| production | 0.1 | 0.1 | 0.1 | 17.8 | 0.6 | 100.0 |
| reprocessing | 462.9 | 462.9 | 796.4 | 799.9 | 99.6 | 100.0 |
| hcxrootd | 729.0 | 731.7 | 1144.1 | 1234.7 | 92.7 | 99.6 |
| analysis | 143147.3 | 148428.5 | 242445.1 | 401364.0 | 60.4 | 96.4 |
| unknown | 0.0 | 0.0 | 0.0 | 0.0 | ||
| ALL_JOBS | 150013.4 | 155336.2 | 250729.1 | 410369.8 | 61.1 | 96.6 |
| jobtype | good_cpu_h | all_cpu_h | good_wallt_h | all_wallt_h | good_wallt_% | good_cpu_eff_% |
|---|---|---|---|---|---|---|
| hctest | 4848.4 | 4871.0 | 6093.8 | 6954.6 | 87.6 | 99.5 |
| production | 629.5 | 3453.5 | 1431.5 | 5837.7 | 24.5 | 18.2 |
| reprocessing | 2967.0 | 3069.8 | 3845.9 | 4754.4 | 80.9 | 96.7 |
| hcxrootd | 166.2 | 167.2 | 393.1 | 420.7 | 93.4 | 99.4 |
| analysis | 25037.5 | 27624.1 | 54453.5 | 115497.7 | 47.1 | 90.6 |
| unknown | 0.0 | 0.0 | 0.0 | 0.0 | ||
| ALL_JOBS | 33648.6 | 39185.6 | 66217.8 | 133465.1 | 49.6 | 85.9 |
LHCb
- Site Availability: Phoenix: 86%, Piz Daint: 80%
- Site Reliability: Phoenix: 91%, Piz Daint: 89%
- Site State Unknown: Phoenix: 5%, Piz Daint: 38%
- Site HS06 delivered: Phoenix: 199 kHS06-days, 174 Piz Daint: kHS06-days -- measured by LHCb (in job)
Site HS06 delivered: Phoenix: 156 kHS06-days, 131 Piz Daint: kHS06-days -- measured by CSCS
- The storage is attached to Phoenix, but Piz Daint is not configured as 'helper', therefore has also some access to the storage on Phoenix from the LHCb point of view.
- Site Availability/Reliability are measured with SAM jobs.
- Piz Daint simulation jobs: Of the 7% failed jobs, 55% stalled, 27% got killed, 16% had an application error.
- Piz Daint reconstruction jobs: Of the 3% failed jobs, 62% stalled, 26% had input resolution error.
- Piz Daint user jobs: Of the 24% failed jobs, 54% got killed, 37% stalled (most likely pilot got killed), 8% had an application error..
CSCS
- Configuration for reference:
- 64 GB of SWAP using DWS on 4 LHC DWS nodes
- 64 core/node allocatable by jobs
- Memory limits set to 6000MB/core, but memory is not a consumable resource, only cores.
- CVMFS tiered cache: upper layer 6GB in RAM, lower layer preloaded on GPFS
- Capacity Phoenix 4404480 core-hours (5920*24*31), utilized at 70%
- Capacity Piz Daint 1264800 core-hours (25*68*24*31), utilized at 78%
- Published HS06 value: 11.19 HS06/core on Phoenix, 12.96 HS06/core on CRAY (830/64, needs to be re-calculated)
Other remarks/notes
- item
Run 7. 2017-10-10 to 2017-11-05 (both inclusive, 26 days). LAST RUN.
Agreed metrics as in Run 1.ATLAS
PROD: Phoenix 98% - Piz Daint 98%
ANALY:Phoenix 98% - Pix Daint 98%
PROD: Phoenix % - Piz Daint %
ANALY:Phoenix % - Pix Daint %
CMS
| jobtype | good_cpu_h | all_cpu_h | good_wallt_h | all_wallt_h | good_wallt_% | good_cpu_eff_% |
|---|---|---|---|---|---|---|
| hctest | 7057.4 | 7059.4 | 8038.8 | 8167.4 | 98.4 | 100.0 |
| production | 409915.8 | 431406.9 | 581209.1 | 720282.5 | 80.7 | 95.0 |
| reprocessing | 170.9 | 170.9 | 366.8 | 366.8 | 100.0 | 100.0 |
| hcxrootd | 532.3 | 533.4 | 798.4 | 2035.6 | 39.2 | 99.8 |
| analysis | 149900.7 | 154513.4 | 205241.6 | 251789.2 | 81.5 | 97.0 |
| unknown | 0.0 | 0.0 | 0.0 | 0.0 | ||
| ALL_JOBS | 567577.1 | 593684.0 | 795654.7 | 982641.5 | 81.0 | 95.6 |
- CSCS measured CMS walltime hours for Phoenix: 1296112
- Fraction of accounted job walltime (CMS / local): 982641.5 / 1296112 => 0.76
| jobtype | good_cpu_h | all_cpu_h | good_wallt_h | all_wallt_h | good_wallt_% | good_cpu_eff_% |
|---|---|---|---|---|---|---|
| hctest | 5510.7 | 5549.9 | 6329.1 | 7171.9 | 88.2 | 99.3 |
| production | 96071.1 | 100042.1 | 139929.2 | 154781.0 | 90.4 | 96.0 |
| reprocessing | 156.7 | 156.7 | 1003.8 | 1003.9 | 100.0 | 100.0 |
| hcxrootd | 193.1 | 193.6 | 359.3 | 1411.5 | 25.5 | 99.7 |
| analysis | 72703.1 | 79637.6 | 91096.4 | 117774.4 | 77.3 | 91.3 |
| unknown | 0.0 | 0.0 | 0.0 | 0.0 | ||
| ALL_JOBS | 174634.7 | 185579.9 | 238717.8 | 282142.7 | 84.6 | 94.1 |
- CSCS measured CMS walltime hours for Piz Daint: 354490
- Fraction of accounted job walltime (CMS / local): 282142.7 / 354490 => 0.80
weekly CMS efficiency
| jobtype | good_cpu_h | all_cpu_h | good_wallt_h | all_wallt_h | good_wallt_% | good_cpu_eff_% |
|---|---|---|---|---|---|---|
| hctest | 1694.3 | 1702.3 | 1978.5 | 2005.5 | 98.7 | 99.5 |
| production | 13774.7 | 13968.2 | 17279.2 | 19689.9 | 87.8 | 98.6 |
| hcxrootd | 35.2 | 35.3 | 66.1 | 74.7 | 88.5 | 99.7 |
| analysis | 11419.6 | 11531.6 | 12782.7 | 15935.5 | 80.2 | 99.0 |
| ALL_JOBS | 26923.8 | 27237.4 | 32106.5 | 37705.6 | 85.2 | 98.8 |
| jobtype | good_cpu_h | all_cpu_h | good_wallt_h | all_wallt_h | good_wallt_% | good_cpu_eff_% |
|---|---|---|---|---|---|---|
| hctest | 2052.3 | 2077.7 | 2329.0 | 2956.6 | 78.8 | 98.8 |
| production | 42200.4 | 43137.0 | 72621.6 | 77336.4 | 93.9 | 97.8 |
| hcxrootd | 77.1 | 77.5 | 115.0 | 1056.2 | 10.9 | 99.5 |
| analysis | 21026.6 | 25143.5 | 25377.1 | 38515.5 | 65.9 | 83.6 |
| unknown | 0.0 | 0.0 | 0.0 | 0.0 | ||
| ALL_JOBS | 65356.4 | 70435.7 | 100442.7 | 119864.7 | 83.8 | 92.8 |
| jobtype | good_cpu_h | all_cpu_h | good_wallt_h | all_wallt_h | good_wallt_% | good_cpu_eff_% |
|---|---|---|---|---|---|---|
| hctest | 1465.6 | 1474.1 | 1750.6 | 1994.0 | 87.8 | 99.4 |
| production | 32458.7 | 34446.1 | 46902.6 | 52890.0 | 88.7 | 94.2 |
| reprocessing | 145.8 | 145.8 | 983.0 | 983.0 | 100.0 | 100.0 |
| hcxrootd | 51.6 | 51.6 | 134.6 | 331.5 | 40.6 | 100.0 |
| analysis | 31451.5 | 34825.2 | 42114.4 | 51559.4 | 81.7 | 90.3 |
| unknown | 0.0 | 0.0 | 0.0 | 0.0 | ||
| ALL_JOBS | 65573.2 | 70942.8 | 91885.2 | 107757.9 | 85.3 | 92.4 |
| jobtype | good_cpu_h | all_cpu_h | good_wallt_h | all_wallt_h | good_wallt_% | good_cpu_eff_% |
|---|---|---|---|---|---|---|
| hctest | 1181.1 | 1183.9 | 1372.6 | 1391.3 | 98.7 | 99.8 |
| production | 21490.6 | 22789.4 | 25158.2 | 29444.8 | 85.4 | 94.3 |
| reprocessing | 156.7 | 156.7 | 1003.8 | 1003.9 | 100.0 | 100.0 |
| hcxrootd | 46.3 | 46.3 | 89.1 | 94.0 | 94.8 | 100.0 |
| analysis | 18164.4 | 18582.8 | 23575.4 | 27271.8 | 86.4 | 97.7 |
| unknown | 0.0 | 0.0 | 0.0 | 0.0 | ||
| ALL_JOBS | 41039.1 | 42759.1 | 51199.1 | 59205.8 | 86.5 | 96.0 |
LHCb
- Site Availability: Phoenix: 100%, Piz Daint: 100%
- Site Reliability: Phoenix: 100%, Piz Daint: 100%
- Site State Unknown: Phoenix: 10%, Piz Daint: 74%
- Site HS06 delivered: Phoenix: 40 kHS06-days, Piz Daint: 129 kHS06-days -- measured by LHCb (in job)
Site HS06 delivered: Phoenix: 37 kHS06-days, Piz Daint: 144 kHS06-days -- measured by CSCS
- The storage is attached to Phoenix, but Piz Daint is not configured as 'helper', therefore has also access to the storage on Phoenix from the LHCb point of view.
- Site Availability/Reliability are measured with SAM jobs.
- Piz Daint simulation jobs: Of the 7% failed jobs, 17% stalled, 82% had an application error.
- Piz Daint reconstruction jobs: Of the 11% failed jobs, 71% stalled, 4% had an application error, 1% had input resolution error.
- Piz Daint user jobs: Of the 8% failed jobs, 28% stalled (most likely pilot got killed), 71% had an application error.
CSCS
- Configuration for reference:
- 64 GB of SWAP using DWS on 4 LHC DWS nodes
- 64 core/node allocatable by jobs
- Memory limits set to 6000MB/core, but memory is not a consumable resource, only cores.
- CVMFS tiered cache: upper layer 6GB in RAM, lower layer preloaded on GPFS
- Capacity Phoenix 3,694,080 core-hours (5920*24*26), utilized at 83,8%
- Capacity Piz Daint 1,060,800 core-hours (25*68*24*26), utilized at 90,2%
- Published HS06 value: 11.19 HS06/core on Phoenix, 12.96 HS06/core on CRAY (830/64, needs to be re-calculated)
Other remarks/notes
- item
- ATLAS-scale-up-test-Nov2017.pdf: ATLAS scale up test


| I | Attachment | History | Action | Size | Date | Who | Comment |
|---|---|---|---|---|---|---|---|
| |
ATLAS-scale-up-test-Nov2017.pdf | r2 r1 | manage | 1453.4 K | 2017-11-10 - 15:37 | GianfrancoSciacca | ATLAS scale up test |
| |
CPU-eff-vs-run.png | r1 | manage | 112.6 K | 2017-09-01 - 13:33 | GianfrancoSciacca | CPU-eff vs run up to 5 |
| |
LHConCRAY-Run4_CSCS.pdf | r1 | manage | 2278.0 K | 2017-08-03 - 11:45 | MiguelGila | Run4 from a system perspective |
| |
LHConCRAY-Run5_CSCS.pdf | r1 | manage | 1108.6 K | 2017-09-01 - 11:55 | MiguelGila | Run5 from a system perspective |
| |
LHConCRAY-Run6_CSCS.pdf | r1 | manage | 1300.9 K | 2017-10-02 - 10:58 | MiguelGila | Run6 from CSCS perspective |
| |
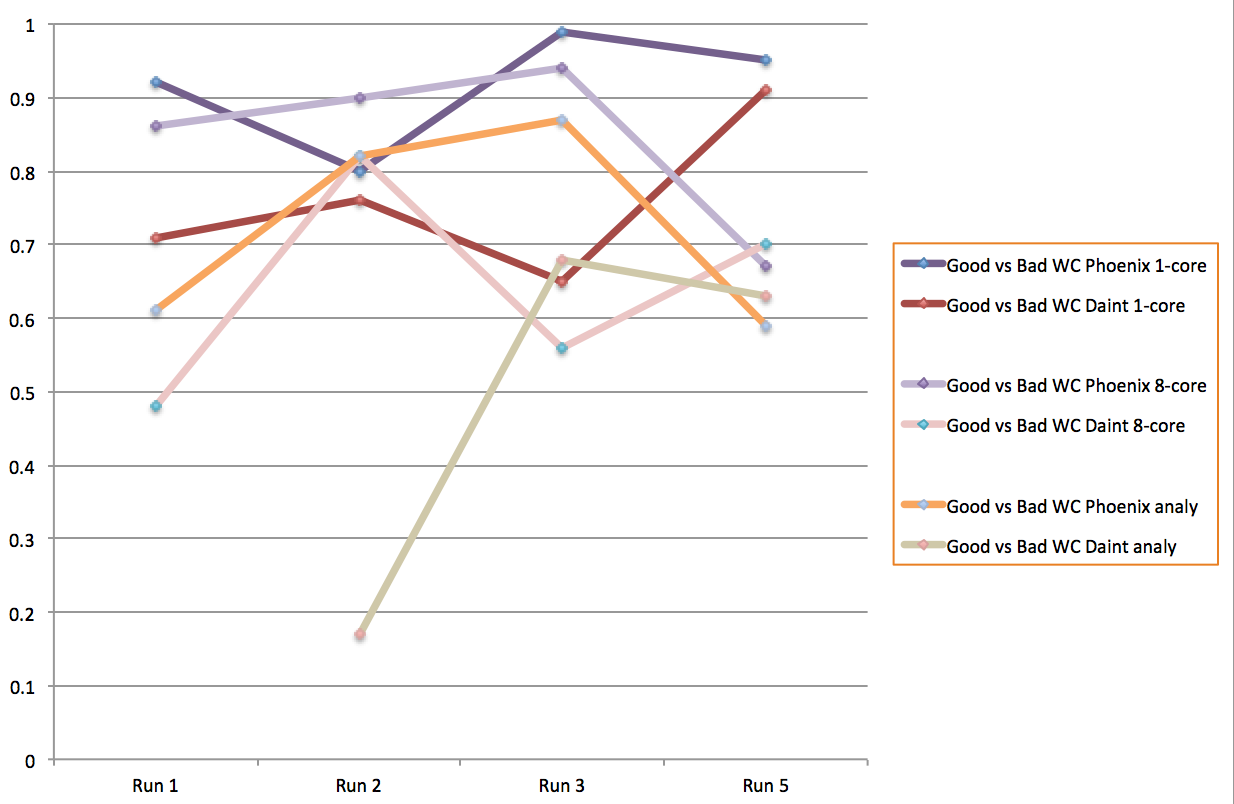
ok-fail-vs-run.png | r1 | manage | 136.3 K | 2017-09-01 - 13:34 | GianfrancoSciacca | ok-fail vs run up to 5 |
Topic revision: r75 - 2017-11-29 - PabloFernandez
|
Warning: Can't find topic "".""
|

|
|
|
Ideas, requests, problems regarding TWiki? Send feedback