6. 6. 2008 Analysis Jobs reading at > 35 MB/s per Job from our Storage
~50 Jobs from Florian Bechtel managed to read with a total of ca. 1600 MB/s from our storage. This is a higher rate as we had seen from any other CMSSW based jobs. Florian reported that he was using CMSSW_2_0_7 running code fromQCDAnalysis/UEAnalysis with a configuration from QCDAnalysis/UEAnalysis/test/ueAnalysisRootFileChain.cfg.
Fileservers' and workers' network plots: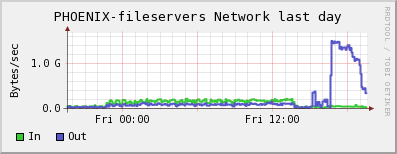
 dCache default (=dcap) movers plot showing the same curve for the number of active movers:
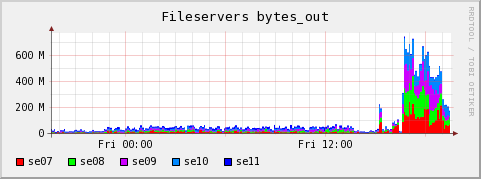
 Plots showing distribution of outwards traffic over fileservers:
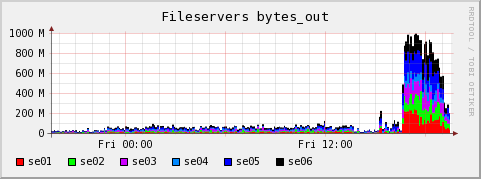
CE Log analysis
The gatekeeper shows 56 jobs having been accepted for Florian Bechtel as user cms022 between 16:34:25 and 16:40:45. However, the PBS accounting logs show that only 50 were started between 16:35:26 and 16:41:29, so 6 seem to have been rejected:PID: 17135 -- Notice: 5: "/C=DE/O=GermanGrid/OU=DESY/CN=Florian Bechtel" mapped to cms022 (18550/1399) $> grep "user=cms022" /var/spool/pbs/server_priv/accounting/20080606|grep -v "Exit_status"|wc -l 50Only 49 are recorded with an exit status, and all exited ok with Exit status
0:
$> grep "user=cms022" 20080606|grep "Exit_status"|wc -l
49
$> grep "user=cms022" 20080606|grep "Exit_status"|sed -e 's/.*\(Exit_status=[0-9]*\).*/\1/'|sort|uniq -c
     49 Exit_status=0
Job running time was distributed like this (minutes and seconds cut away by the sed expression):
$> grep "user=cms022" 20080606|grep "Exit_status"|sed -e 's/.*\(resources_used.walltime=[^:]*\).*/\1/'|sort|uniq -c
      4 resources_used.walltime=00
     11 resources_used.walltime=01
     30 resources_used.walltime=02
      4 resources_used.walltime=03
Two jobs almost finished immediately in the first 10 minutes, so we can assume that the load derived from ~47 jobs.
$> grep "user=cms022" 20080606|grep "Exit_status"|sed -ne 's/.*\(resources_used.walltime=00:[^:]*\).*/\1/p'|sort
resources_used.walltime=00:02
resources_used.walltime=00:06
resources_used.walltime=00:16
resources_used.walltime=00:37
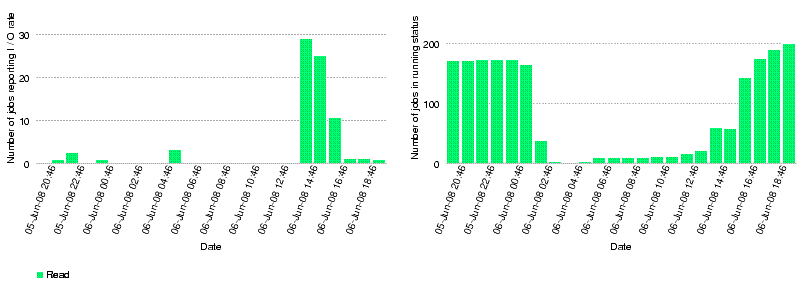
Comparison with I/O rate monitoring by CMS dashboard
The dashboard shows that at the peak rate less than 30 jobs were reporting I/O rates. The averaged I/O rates at that time were higher than 40 MB/s. Note that there is a 2h time difference between dashboard time and local time.
 Julia Andreeva's explanation for the interpretation of the I/O graphs:
  Show
Show  Hide
Hide
Just few explanations regarding what is shown at the plots: The right plot at the bottom of the page shows number of jobs running in parallel. Not necessary all of them had been reporting IO rate. You mentioned that there were ~50 jobs from Florian at that point, dashboard shows a bit more, may be there were other users as well. Number of reporting jobs (left plot in the bottom of the page) shows jobs running in parallel and those which did report but taking into account the probability that the actual reading or writing operation happened at a given point of time. This probability is calculated by dividing the duration of operation by the life time of the job. So if there were 50 jobs running in parallel and reporting IO rate the plot would show slightly lower number taking into account the probability described above. Finally, the rate per job is calculated as overall value of read/written bytes divided by life time of the job and for aggregated rate we sum up all per job rate for all jobs in running status.
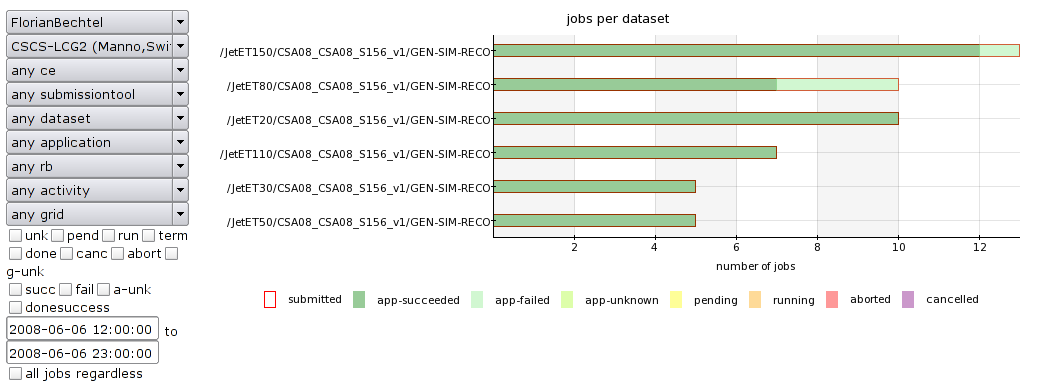
Further dashboard analysis
Link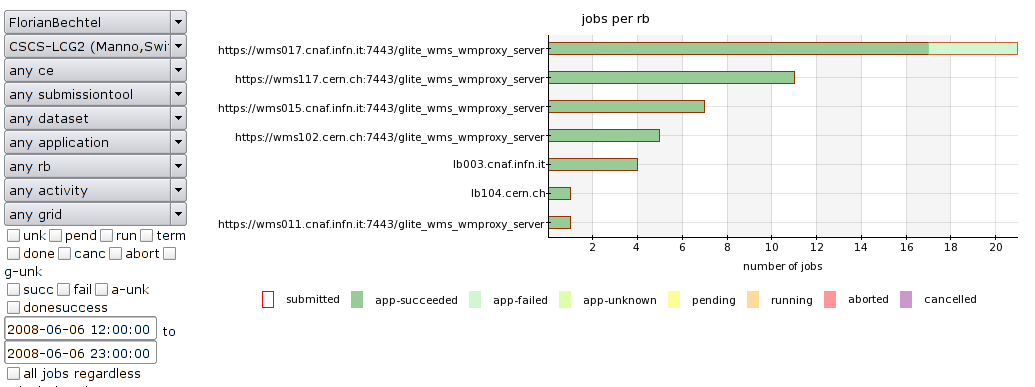
Links to discussion about this
- Link to the related Hypernews mail thread
 .
.
- Brian Bockleman's page on how to examine dcache read-ahead
.fjr file Show Hide
FJR file provided by Florian: https://hypernews.cern.ch/HyperNews/CMS/get/AUX/2008/06/07/15:56:51-62243-crab_fjr_1.xml
Show Hide
Hi,
I confirm we are working on improvements to the file adaptor layer.
There is a new caching strategy in ROOT that we are currently testing
(TTreeCache), and we're currently running tests with it, however
results so far look somewhat wanting at this stage (not entirely
unexpected).
Last Friday Giulio, Pete and myself discussed our options, and in
particular code to be included in CMSSW 2.1.0. I proposed to rework
the I/O stack somewhat because frankly I don't think ROOT's I/O can
be redeemed with any sort of caching layer. I hope to have the code
tested this week, and we'll then see what consequences it will have
"in the wild."
Specifically we intend to cache 128 MB slices of the files in the
operating system local buffer cache as they are accessed. This would
translate in near-optimal reads, never reading more than the entire
file from the mass store, and if the file is suitably organised, we
could still read only parts of the file. Actual ROOT I/O would only
ever access the file via the operating system buffer cache, which
would significantly soften the issues with bad I/O patterns.
Please note the caching would only cache sections of open files.
There is no intention to cache entire files, let alone all files the
job will consume. The cache memory would not be accounted against
the CMSSW process -- it's operating system memory, active but not
visible in VSIZE or RSS -- but of course forms part of the process
requirements. It is expected the 128 MB slice is more than plenty,
and likely use is less.
Lassi


| I | Attachment | History |
Action | Size | Date | Who | Comment |
|---|---|---|---|---|---|---|---|
| |
PHOENIX-fileserversA-bytes_out-day.gif | r1 | manage | 18.9 K | 2008-06-07 - 07:38 | DerekFeichtinger | |
| |
PHOENIX-fileserversB-bytes_out-day.gif | r1 | manage | 17.0 K | 2008-06-07 - 07:39 | DerekFeichtinger | |
| |
dashboard-datasets.png | r1 | manage | 42.8 K | 2008-06-07 - 09:15 | DerekFeichtinger | |
| |
dashboard-rb.png | r1 | manage | 42.9 K | 2008-06-07 - 09:14 | DerekFeichtinger | |
| |
dashboardIO-avgread.png | r1 | manage | 5.0 K | 2008-06-07 - 09:01 | DerekFeichtinger | |
| |
dashboardIO-numjobs.png | r1 | manage | 5.5 K | 2008-06-07 - 09:01 | DerekFeichtinger | |
| |
fileservers-nw-report-20080606-1932-day.gif | r1 | manage | 14.8 K | 2008-06-07 - 07:35 | DerekFeichtinger | |
| |
movers_default-20080606-1932-day.gif | r1 | manage | 13.3 K | 2008-06-07 - 07:33 | DerekFeichtinger | |
| |
worker-nw-report-20080606-1932-day.gif | r1 | manage | 12.8 K | 2008-06-07 - 07:40 | DerekFeichtinger |
Topic revision: r4 - 2008-06-09 - DerekFeichtinger

Ideas, requests, problems regarding TWiki? Send feedback